Research infrastructure for serious investors.
Statements, models and filings for thousands of public companies.
Free plan, no credit card · 7-day Pro trial with a card
Statements, models and filings for thousands of public companies.
Free plan, no credit card · 7-day Pro trial with a card


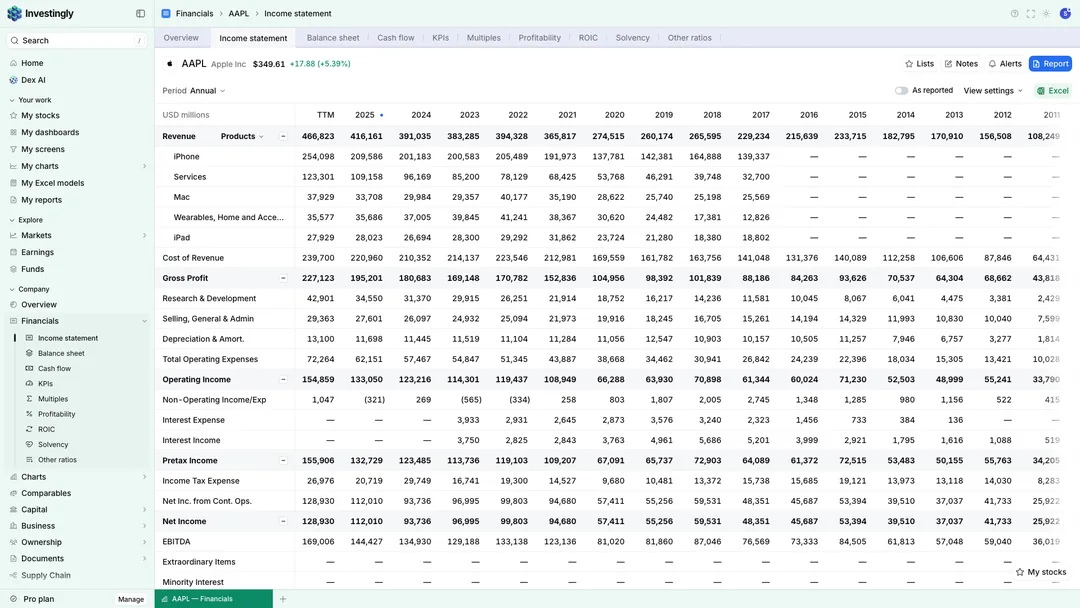
| FY19 | FY20 | FY21 | FY22 | FY23 | FY24 | FY25 | |
|---|---|---|---|---|---|---|---|
| Revenue | 260.2 | 274.5 | 365.8 | 394.3 | 383.3 | 391.0 | 416.2 |
| Gross profit | 98.4 | 104.9 | 152.8 | 170.8 | 169.1 | 180.7 | 195.2 |
| Operating income | 63.9 | 66.3 | 108.9 | 119.4 | 114.3 | 123.2 | 133.1 |
| Net income | 55.3 | 57.4 | 94.7 | 99.8 | 97.0 | 93.7 | 112.0 |
| Net margin | 21.3% | 20.9% | 25.9% | 25.3% | 25.3% | 24.0% | 26.9% |
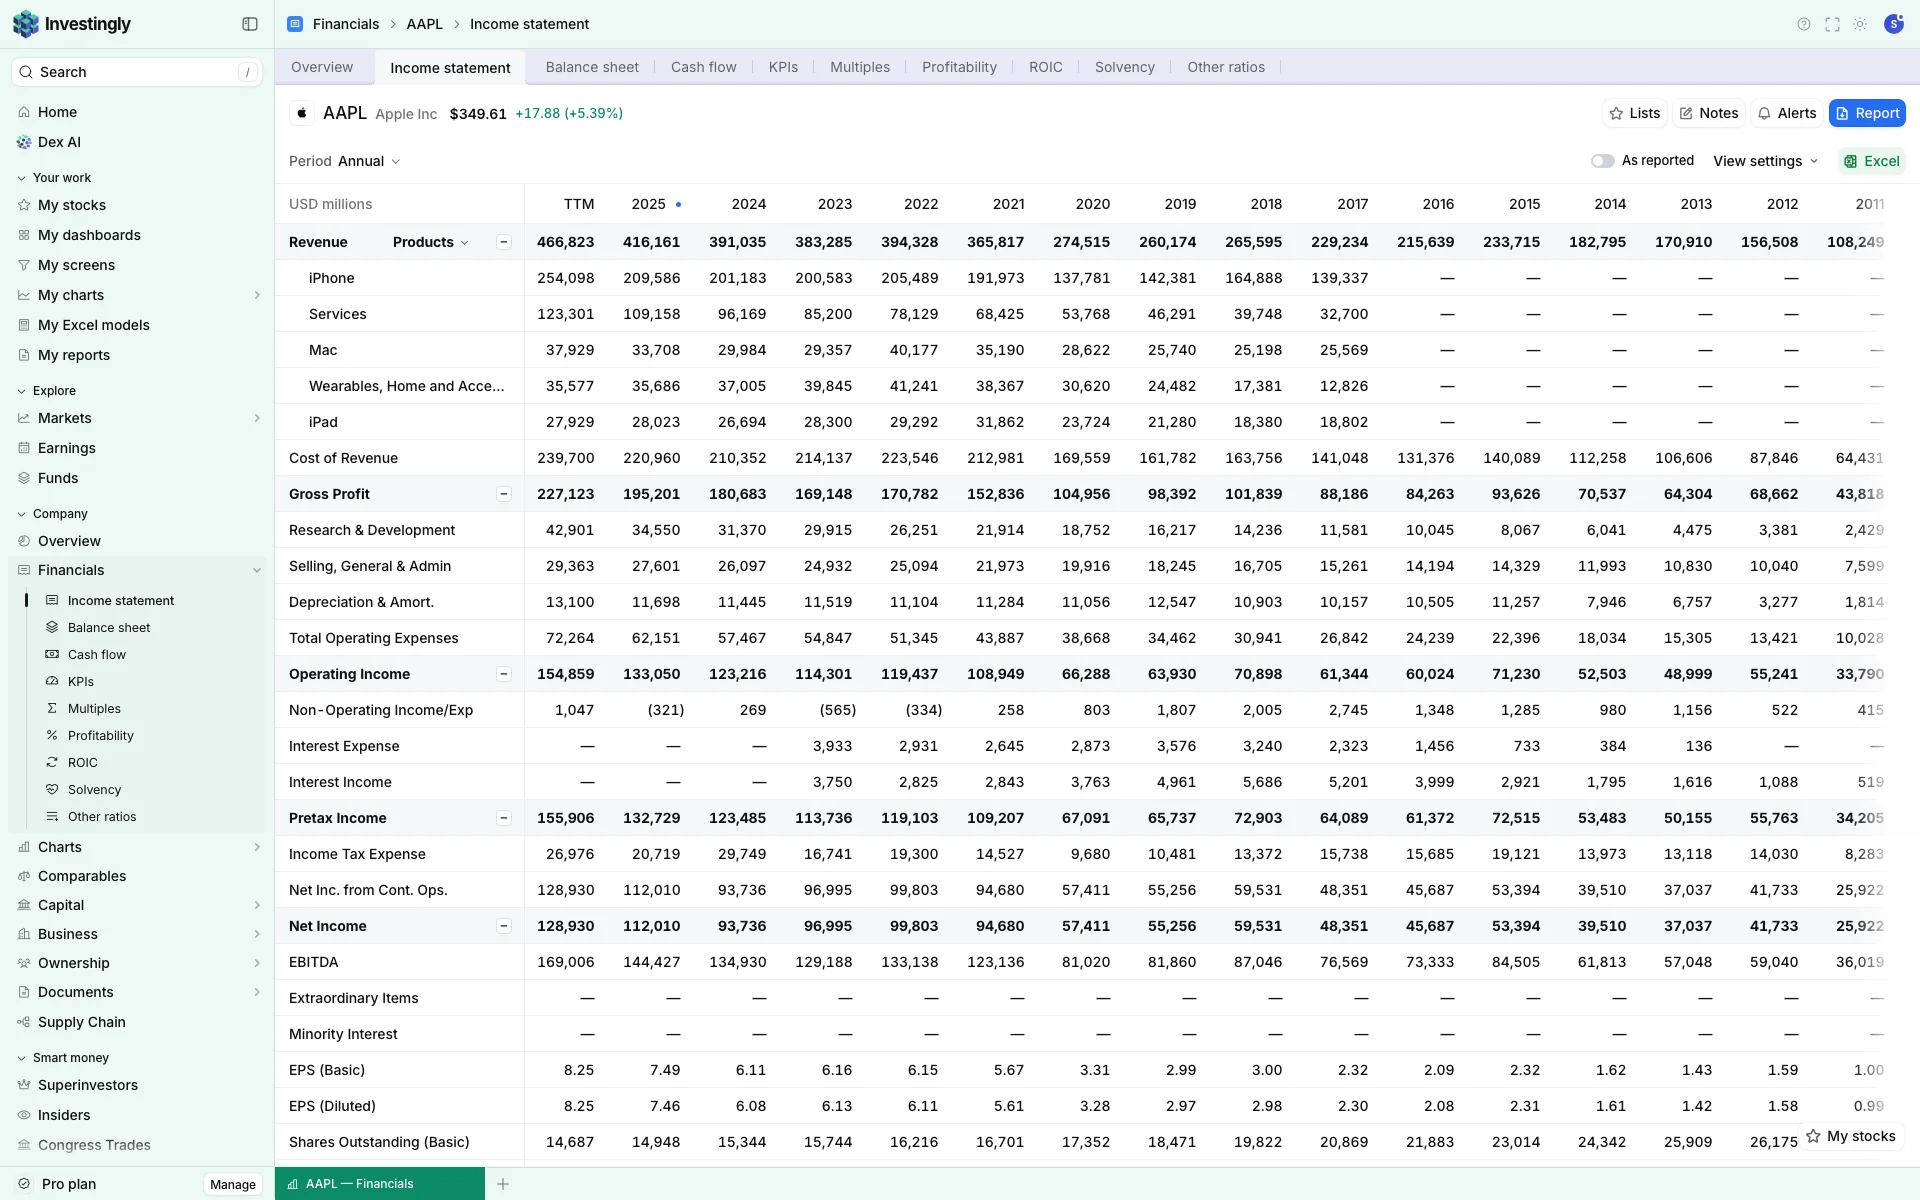
Revenue, profit, cash flow and returns in one grid. Click any statement line to chart it.
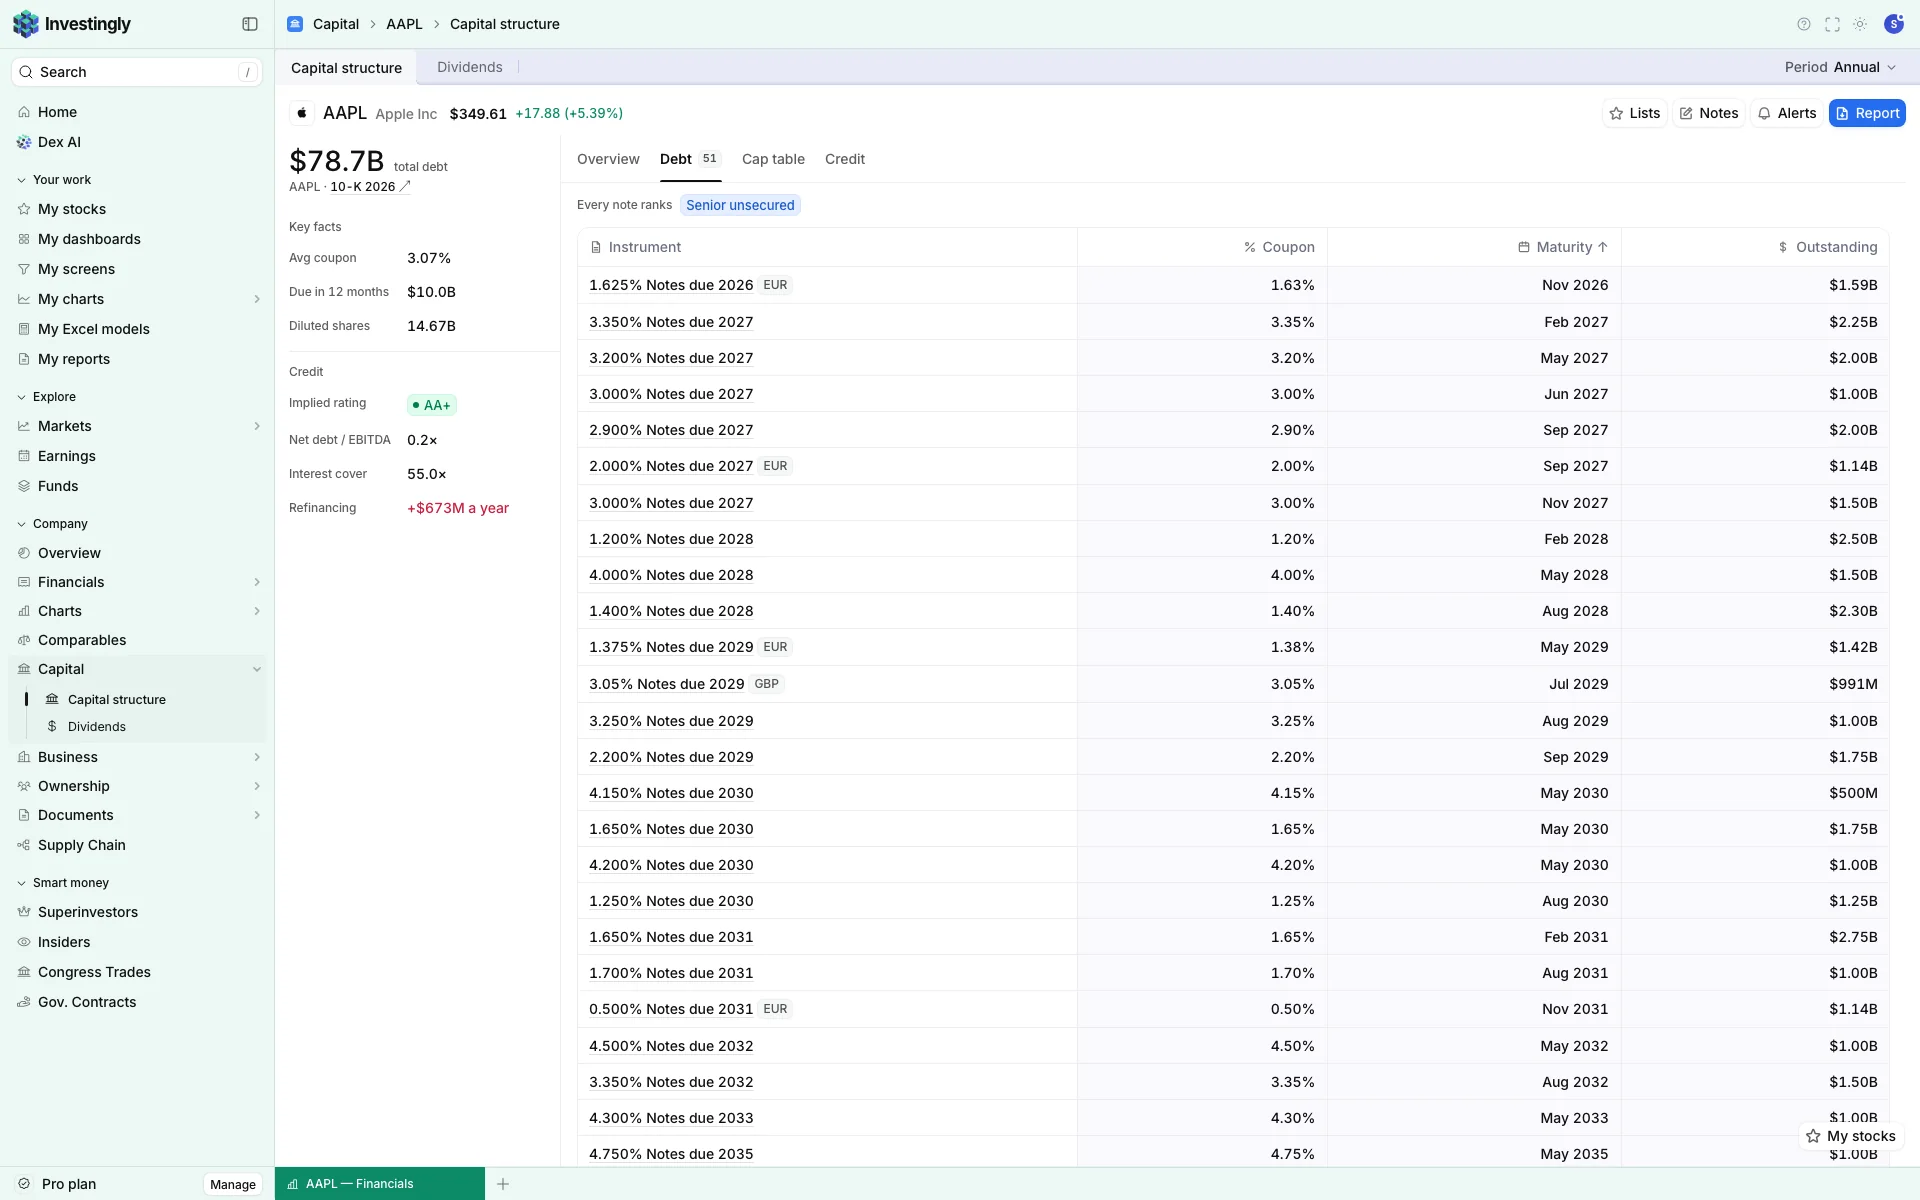
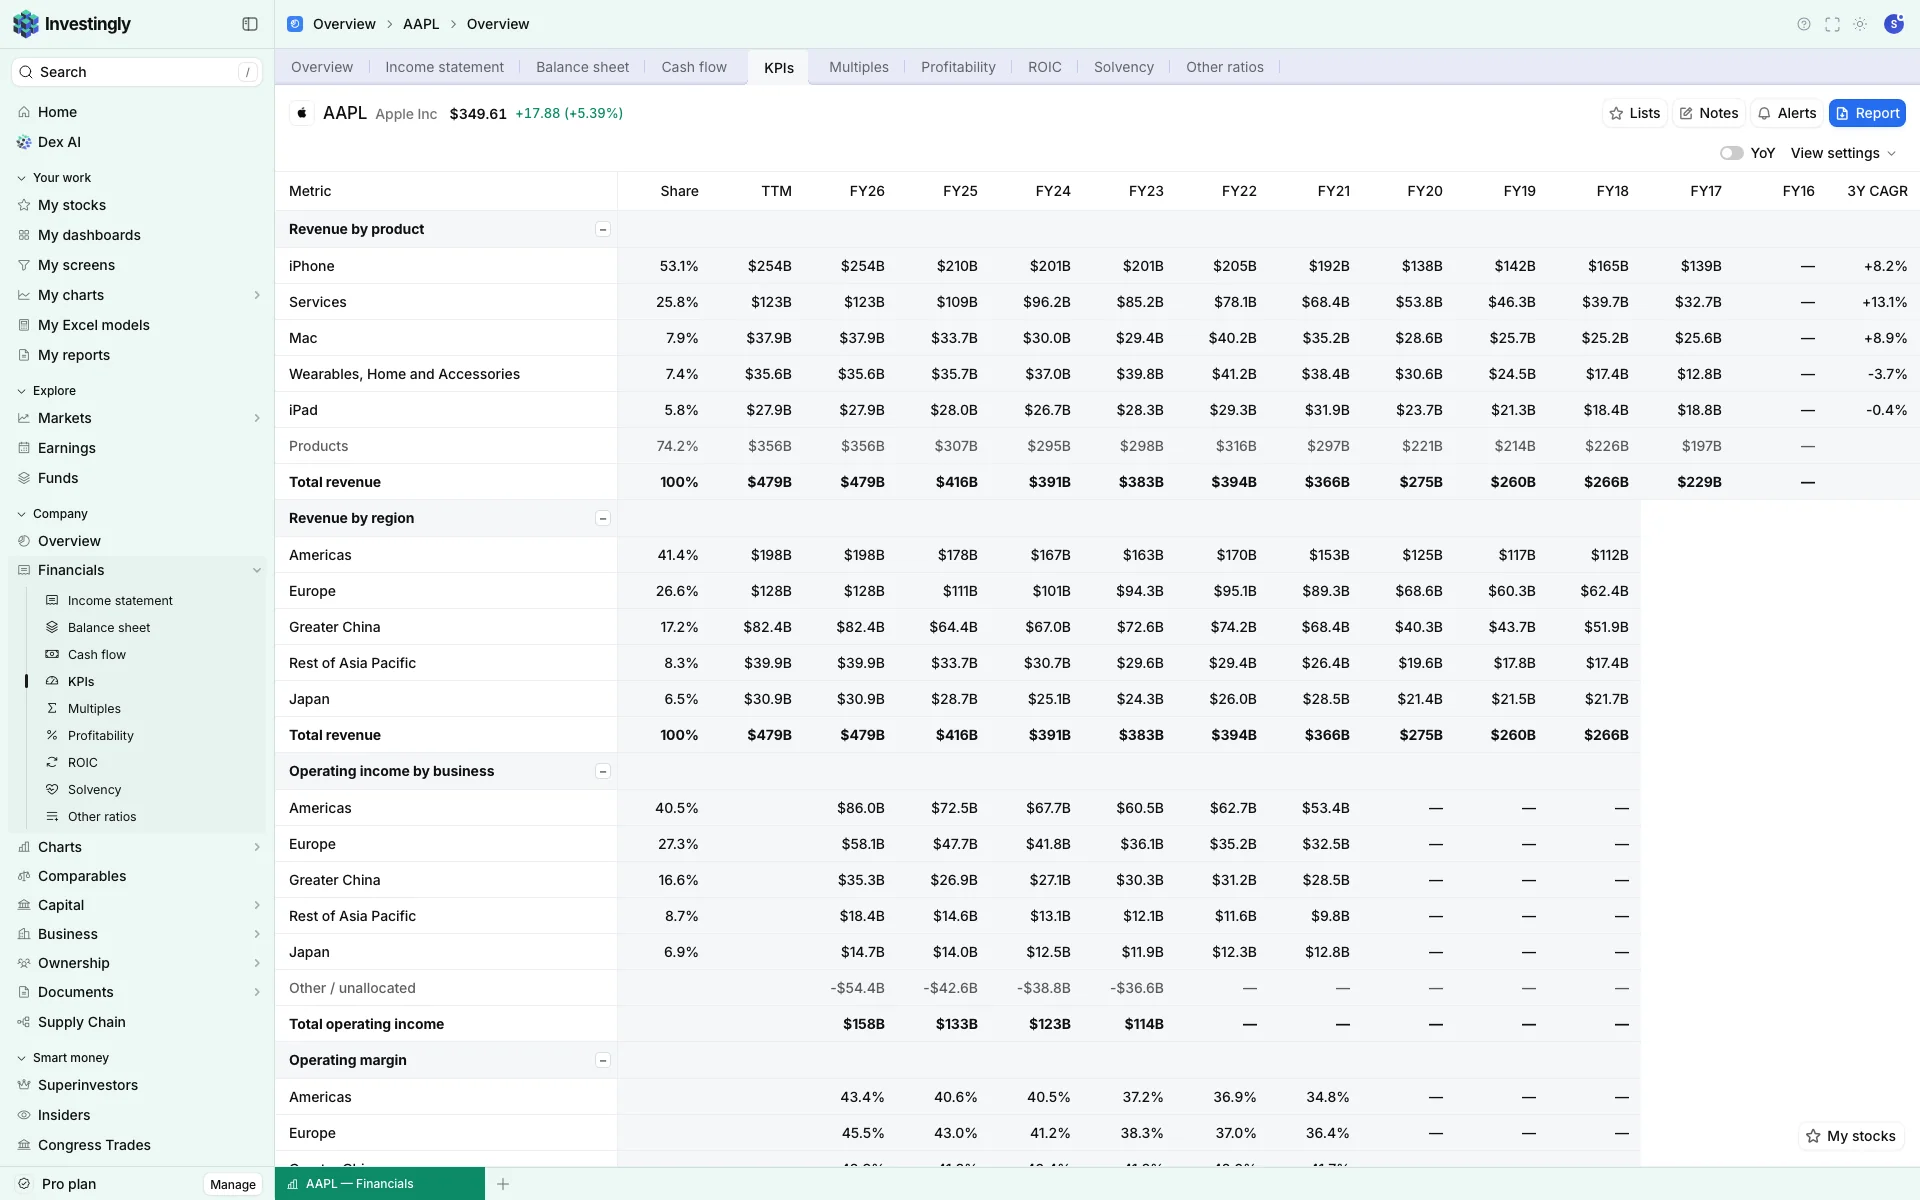
Every bond and loan the company has outstanding, with its coupon, maturity and what comes due each year.
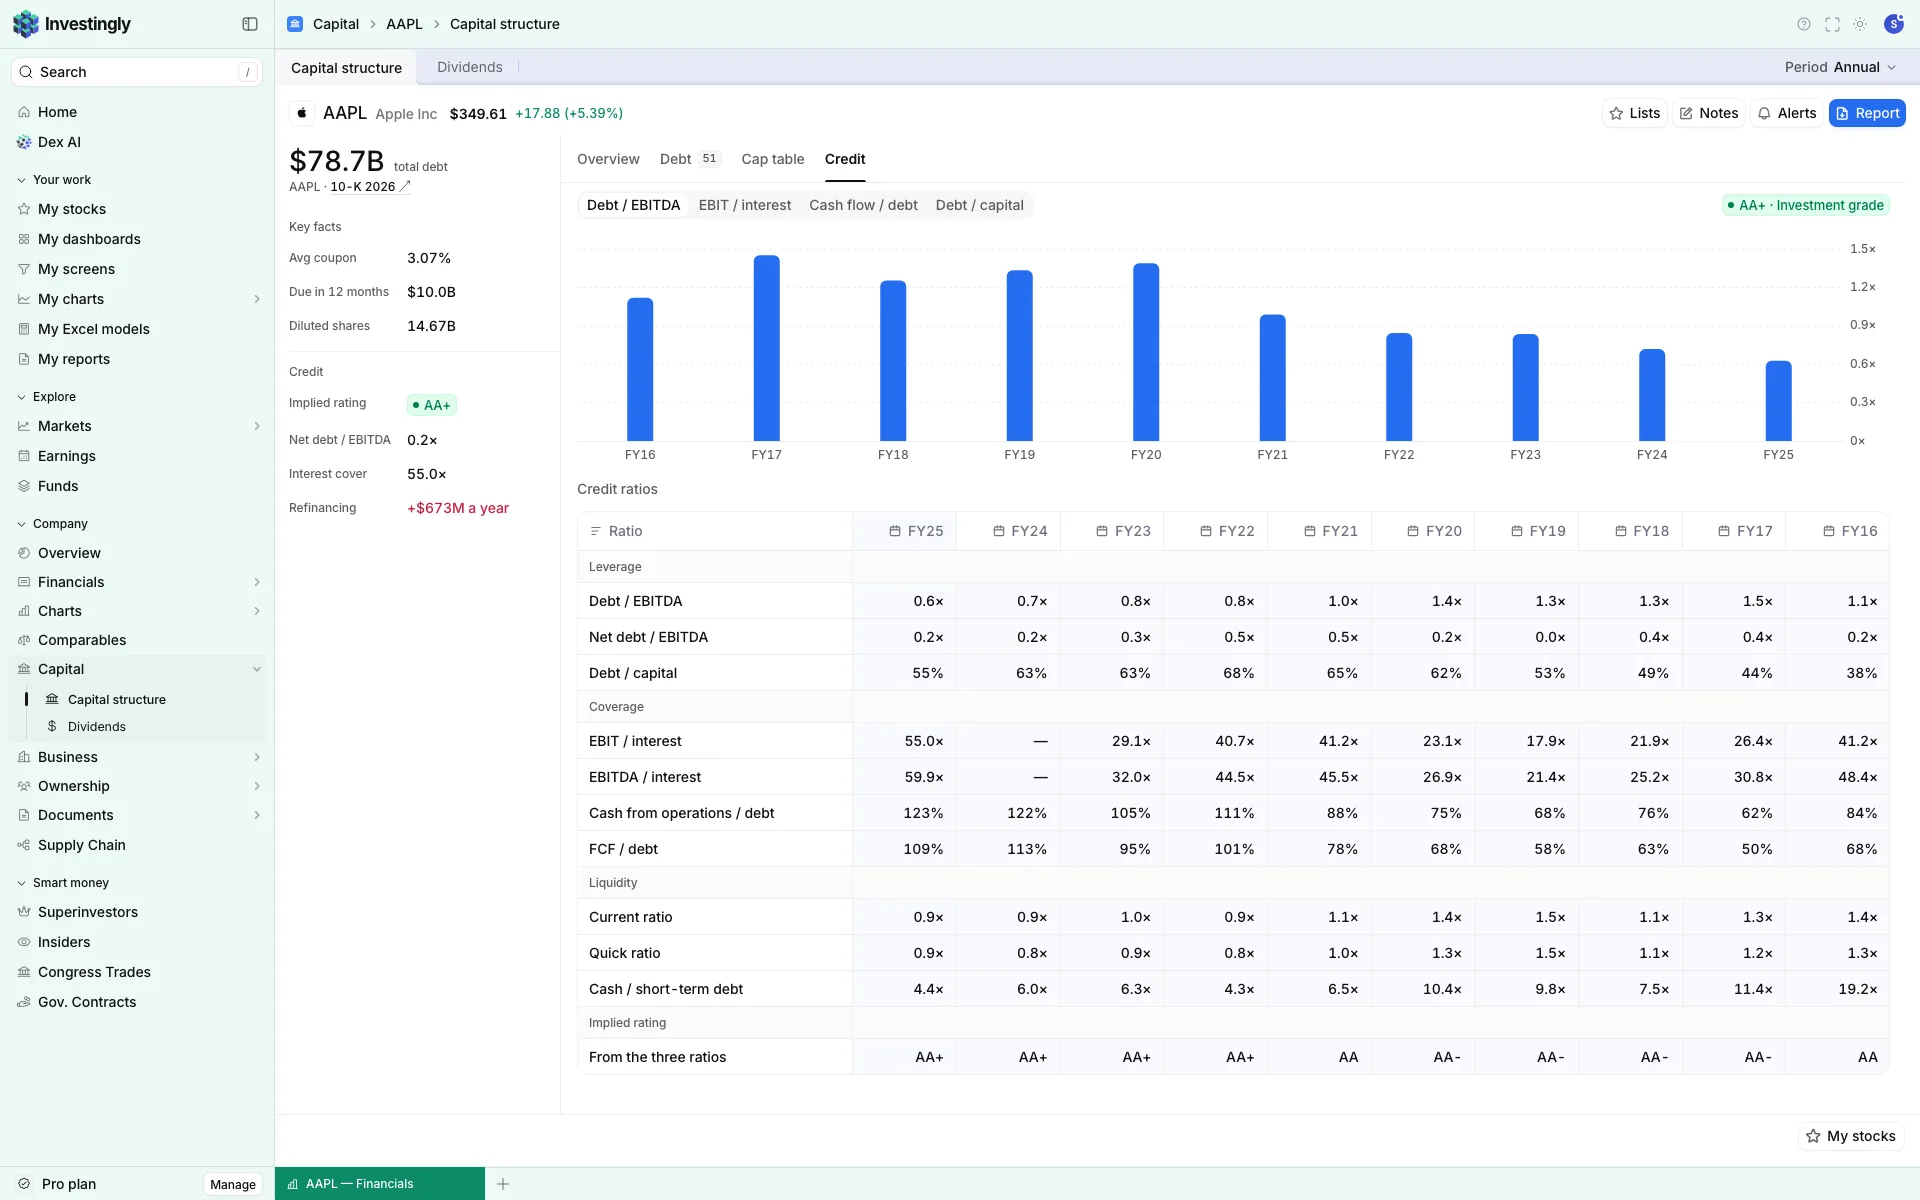
Leverage, interest cover and an implied credit rating, worked out from the company's own numbers.
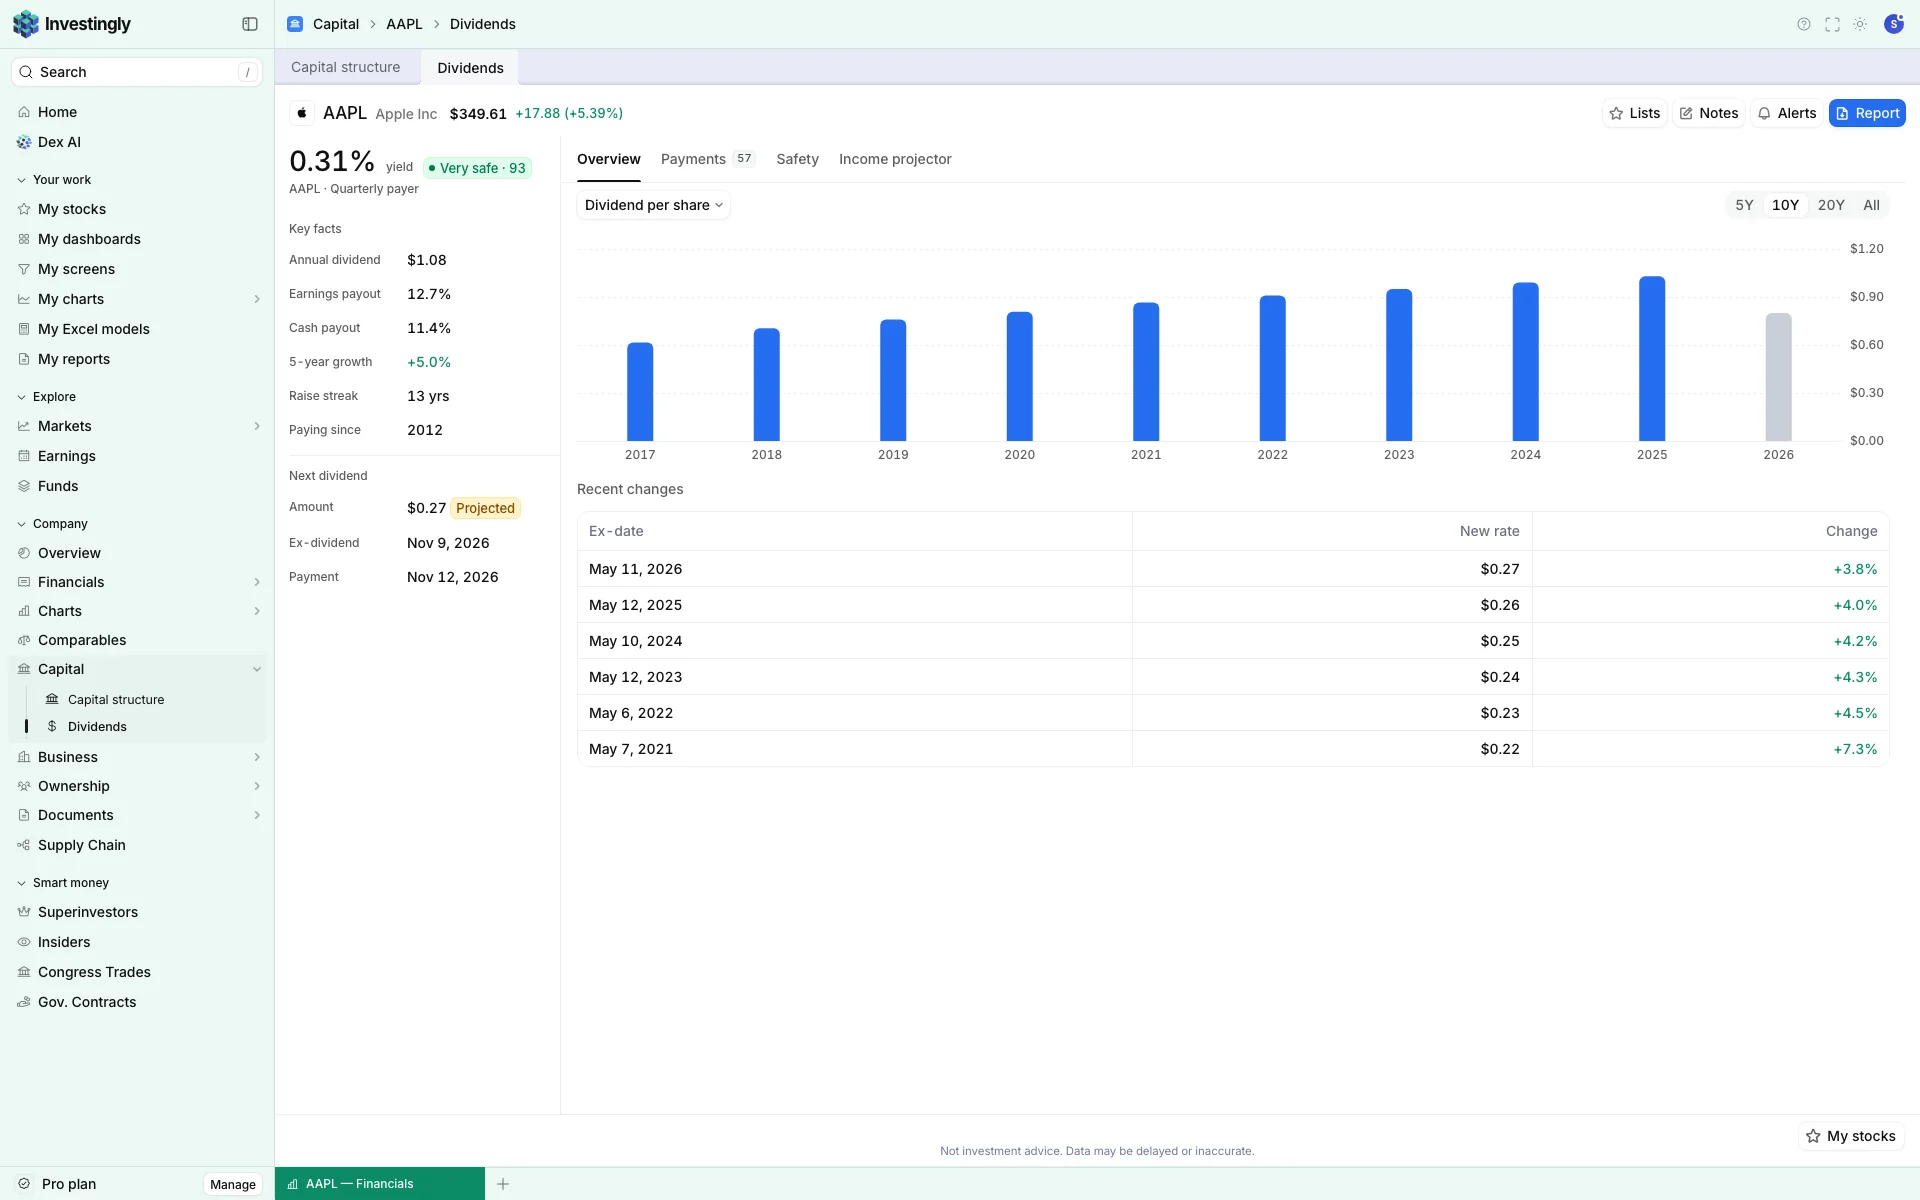
Dividend per share over the years, with the yield, payout ratio, next payment and a safety score.
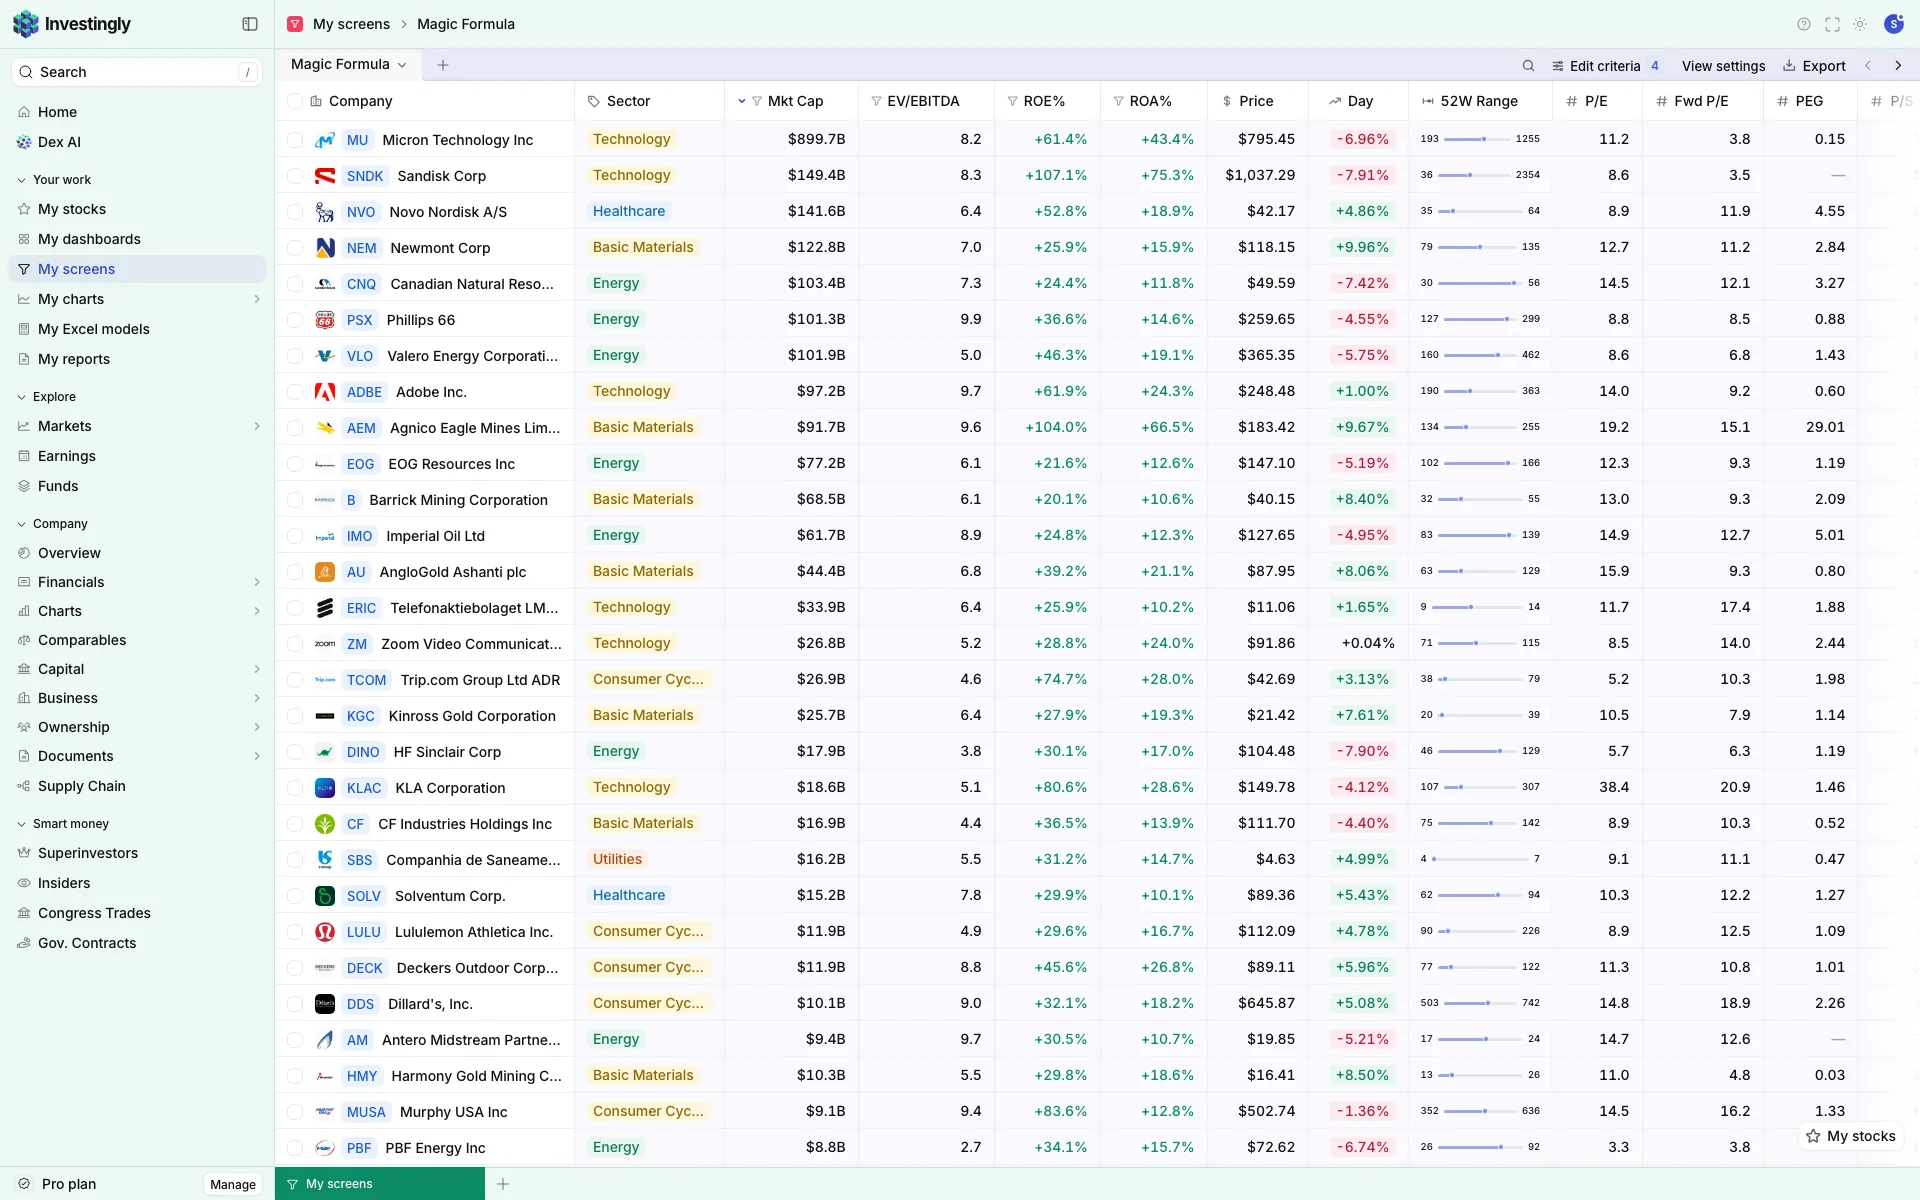
| Ticker | P/E | ROE | 1Y |
|---|---|---|---|
| ASML | 18.4 | 52% | +12% |
| MELI | 19.7 | 41% | +23% |
| ULVR | 17.9 | 33% | +6% |
| 7203 | 9.1 | 16% | −4% |
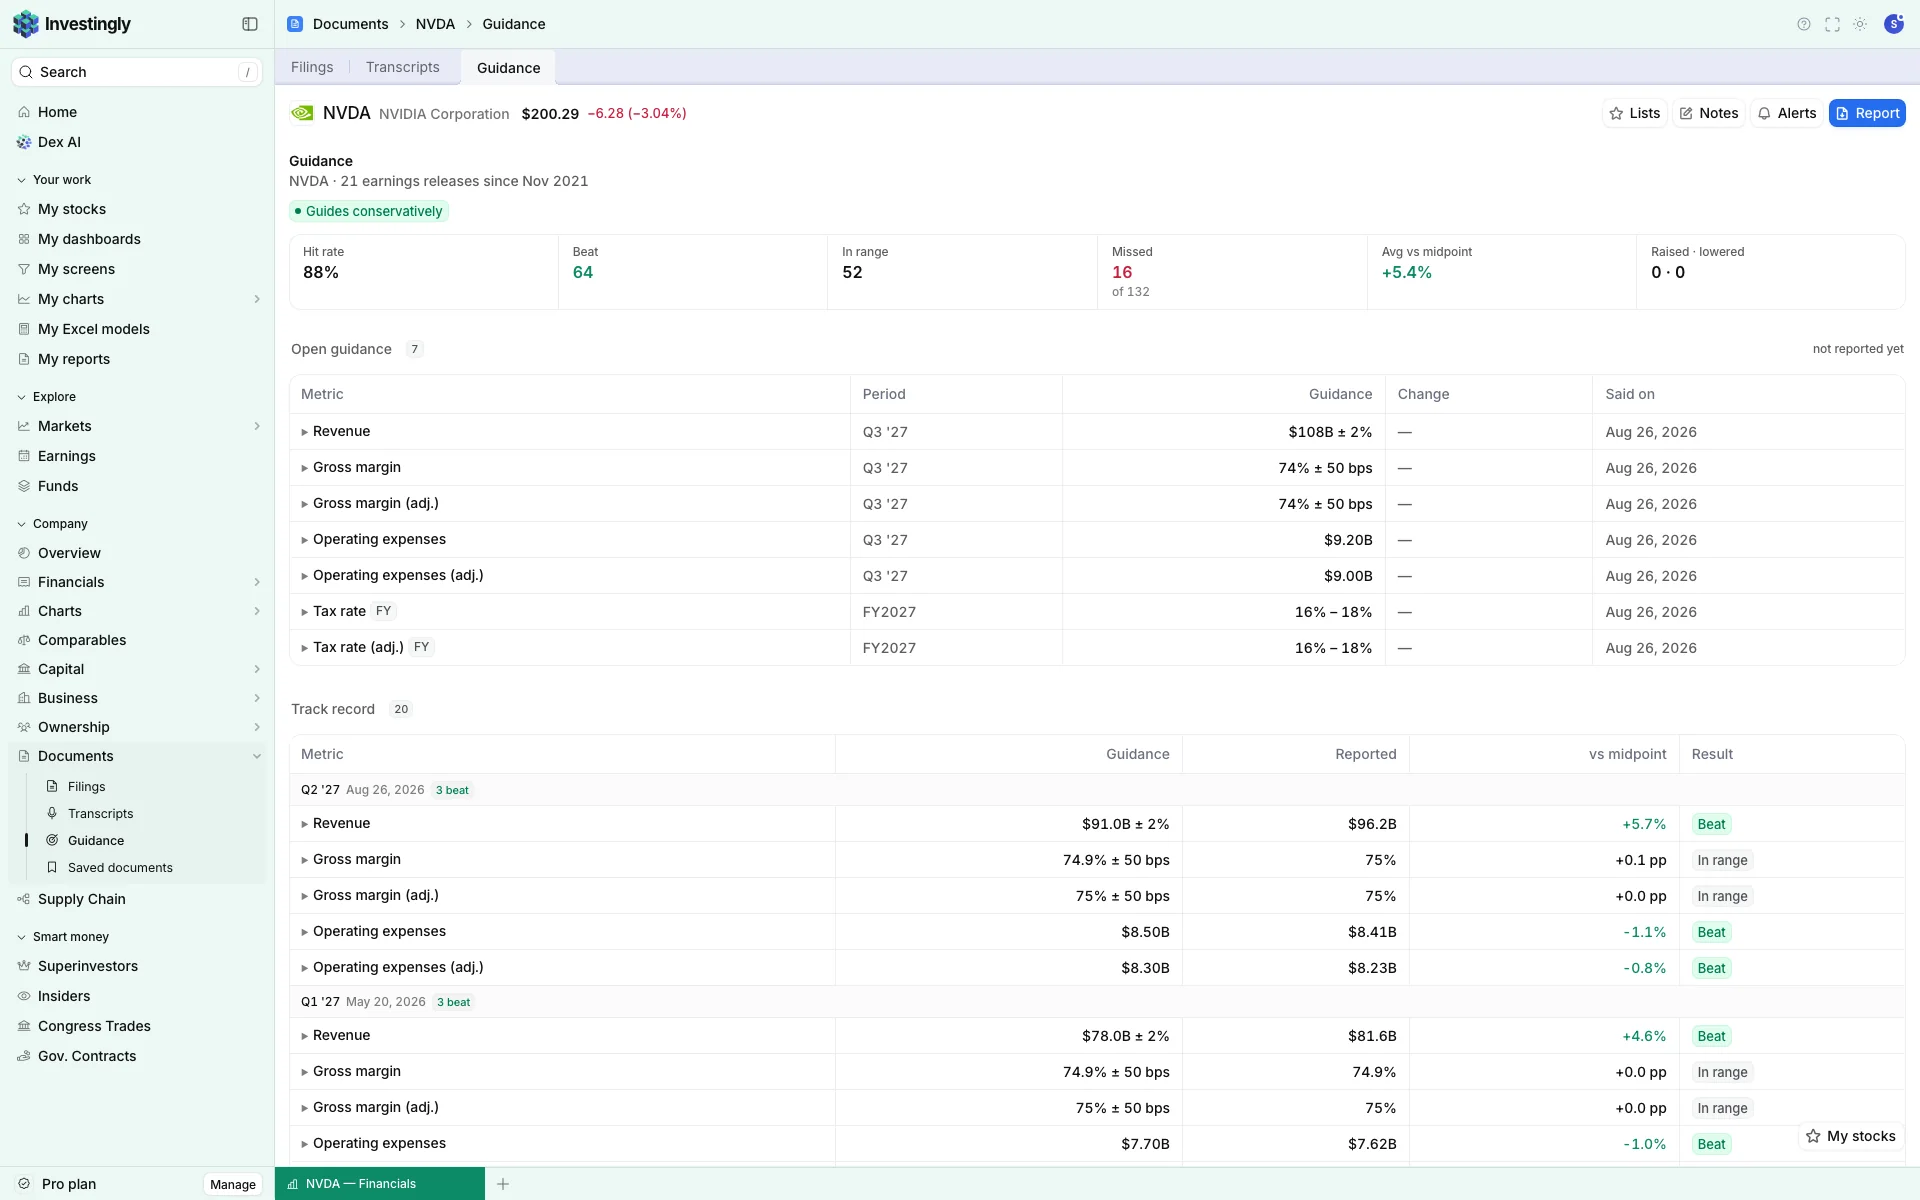
Each quarter's guidance next to what the company then reported, so you can see whether management tends to beat.
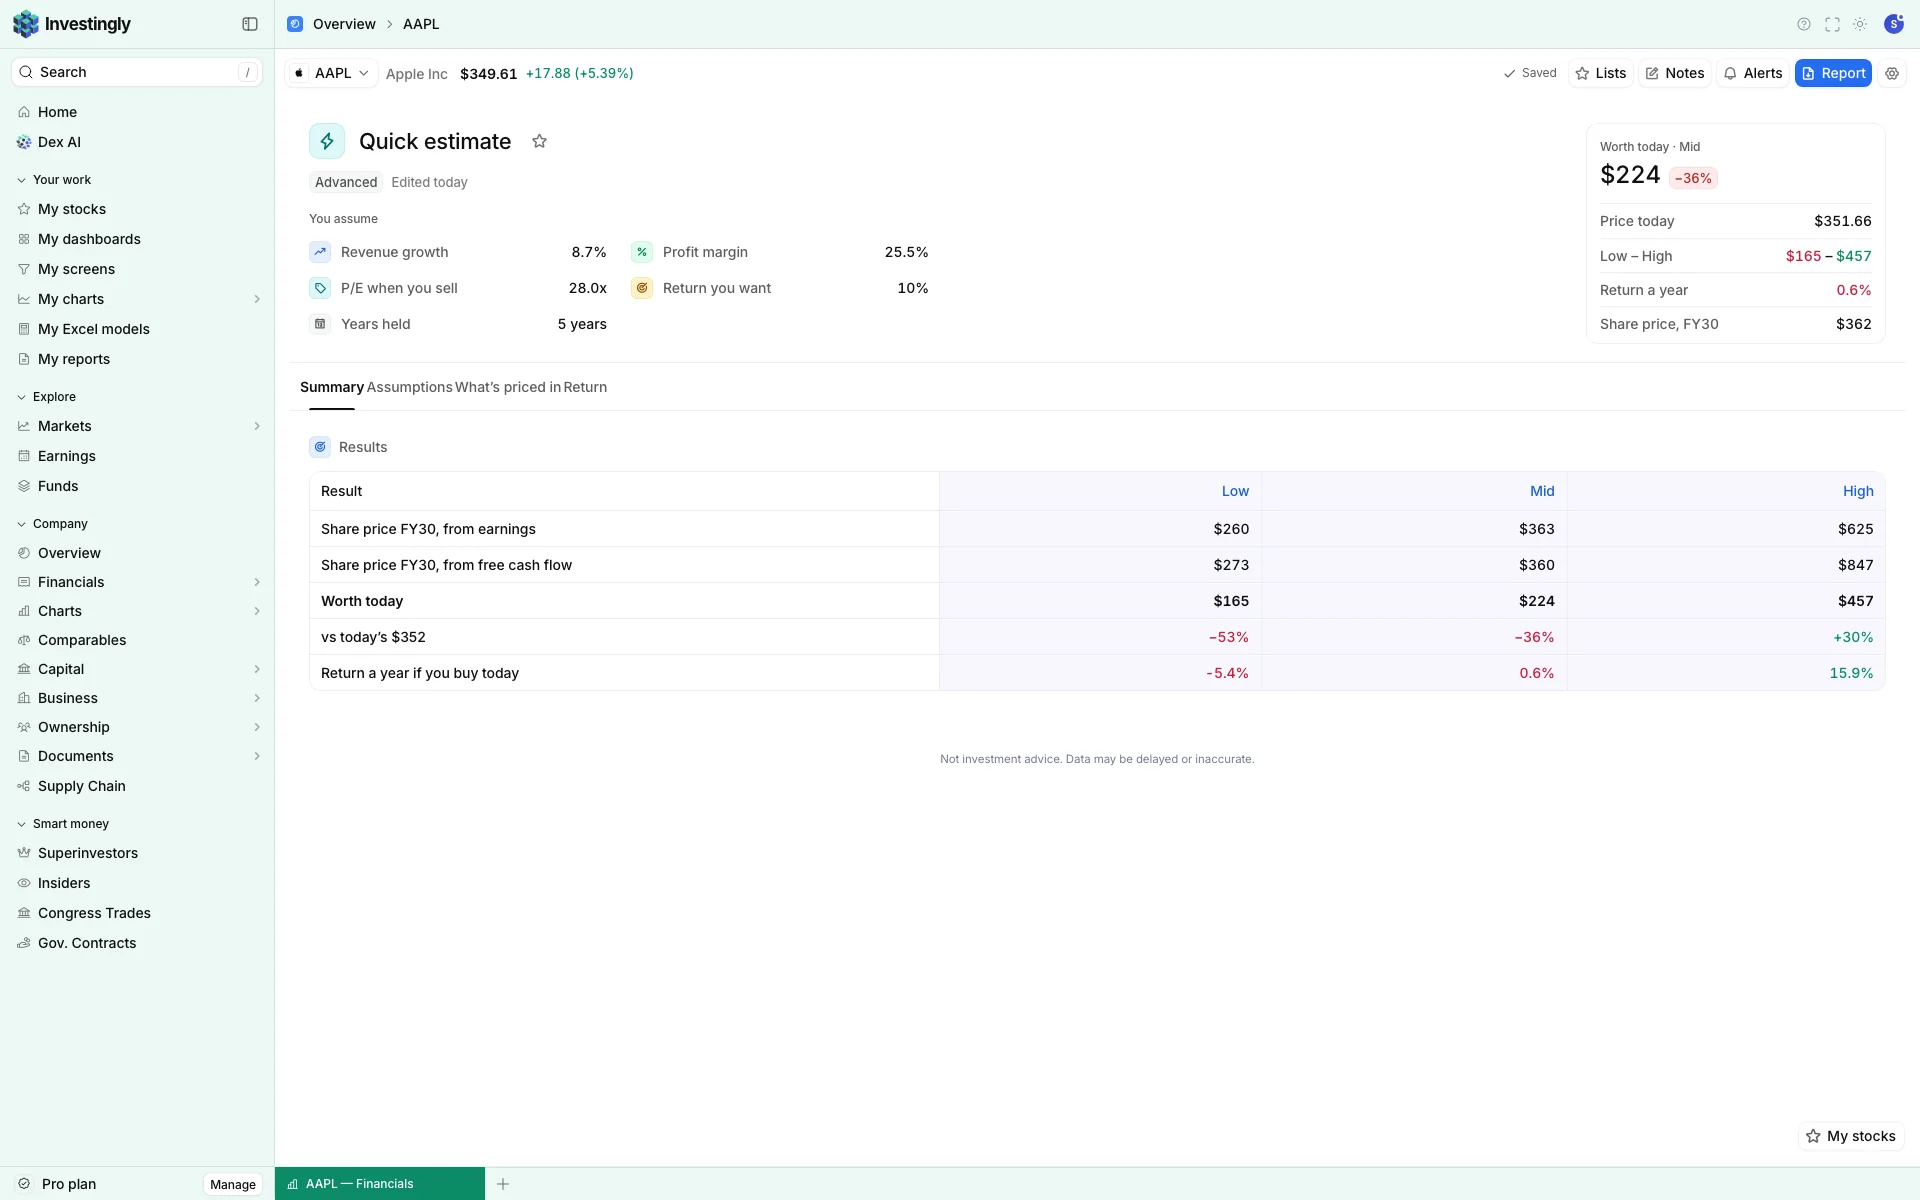
Valuation, growth and returns side by side for any set of companies, with a fair value from where the peers trade.
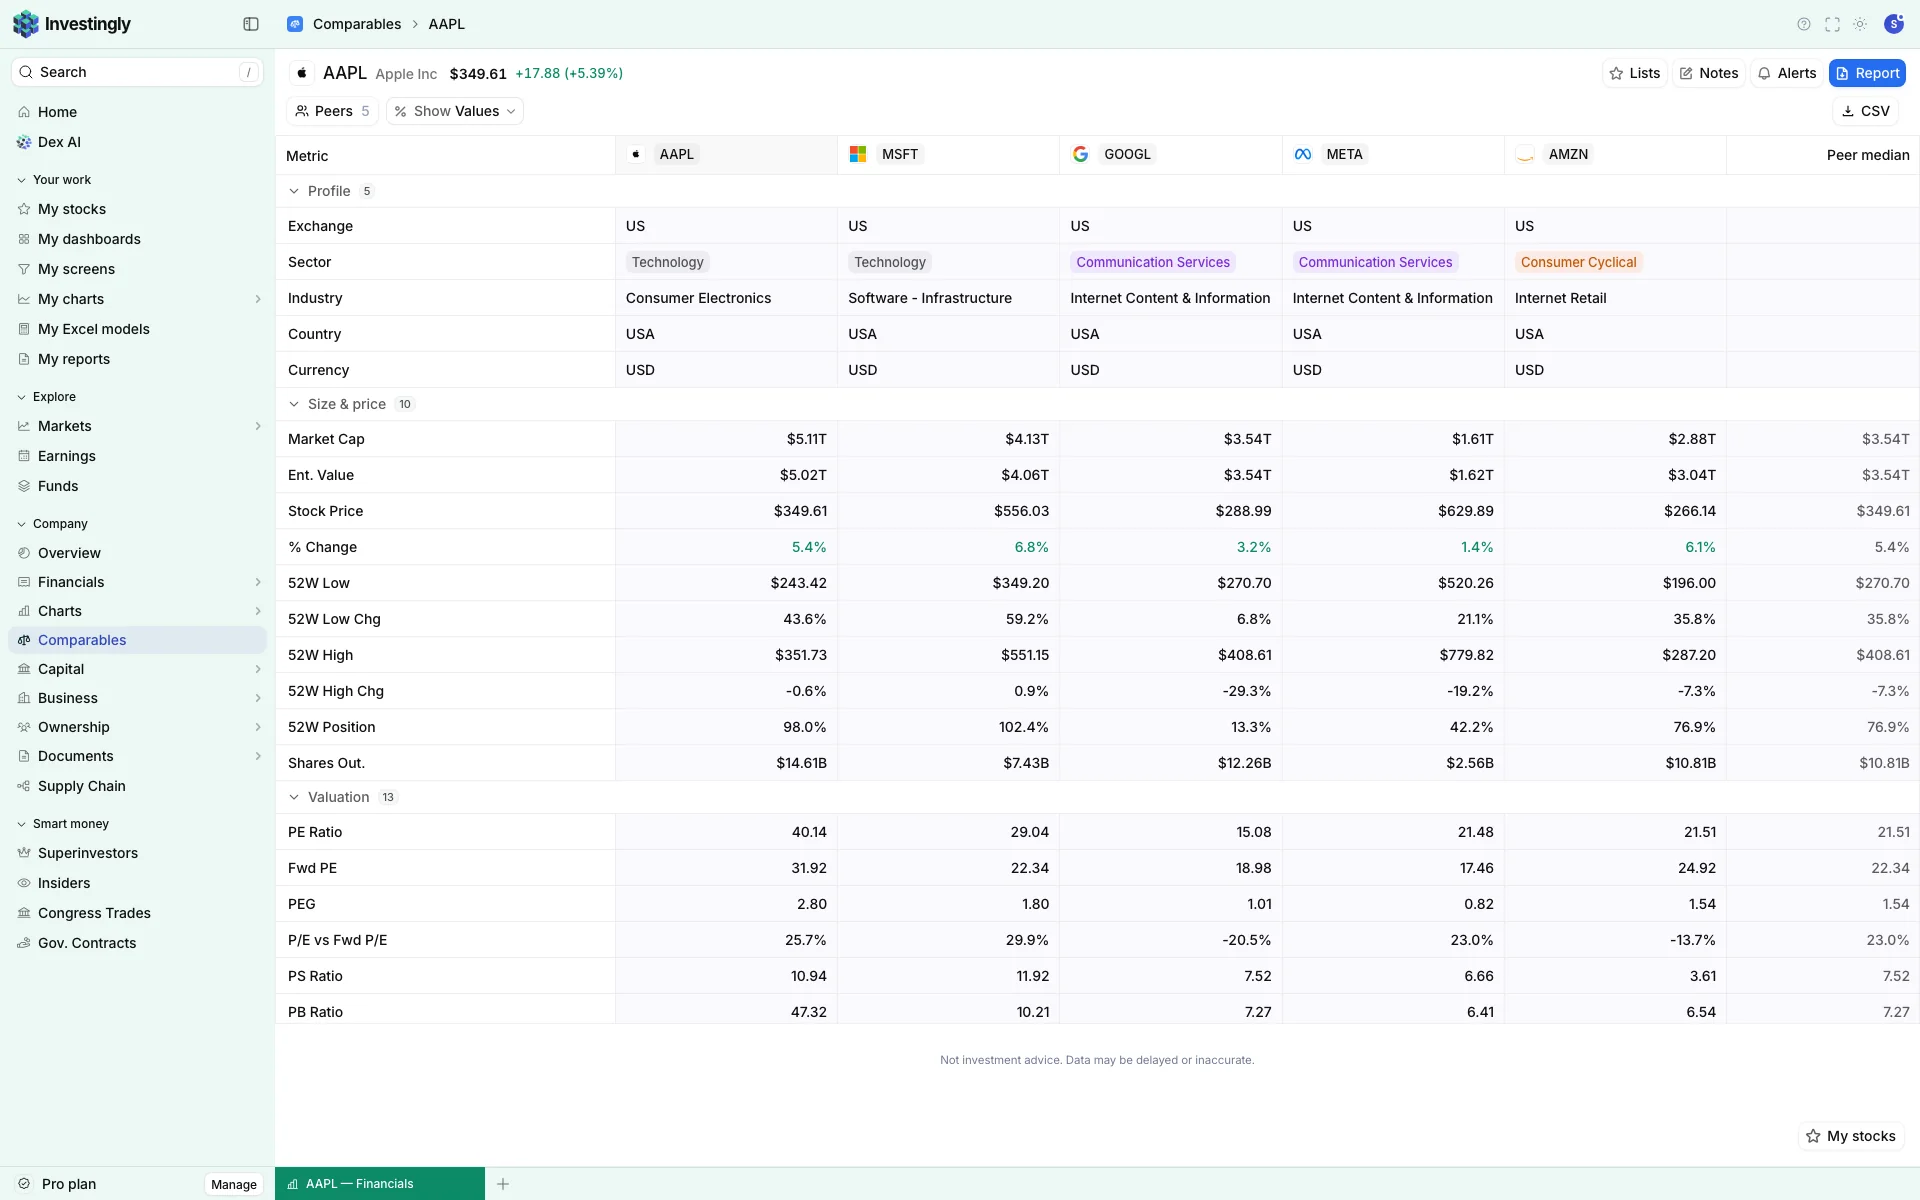
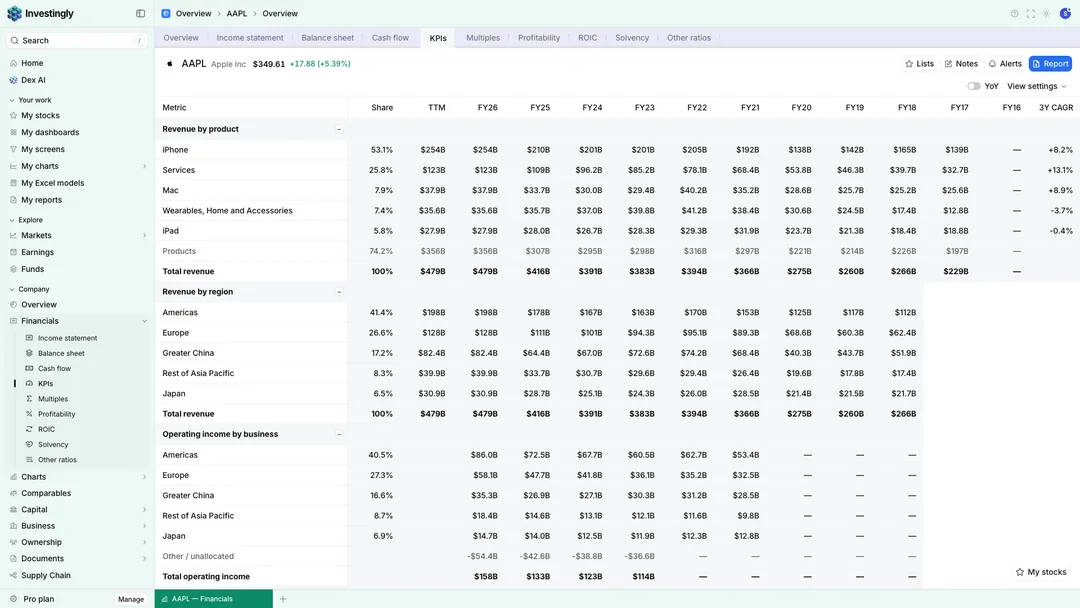
P/E, EV/EBITDA, margins and returns over time, so you can see whether today is cheap for this company.
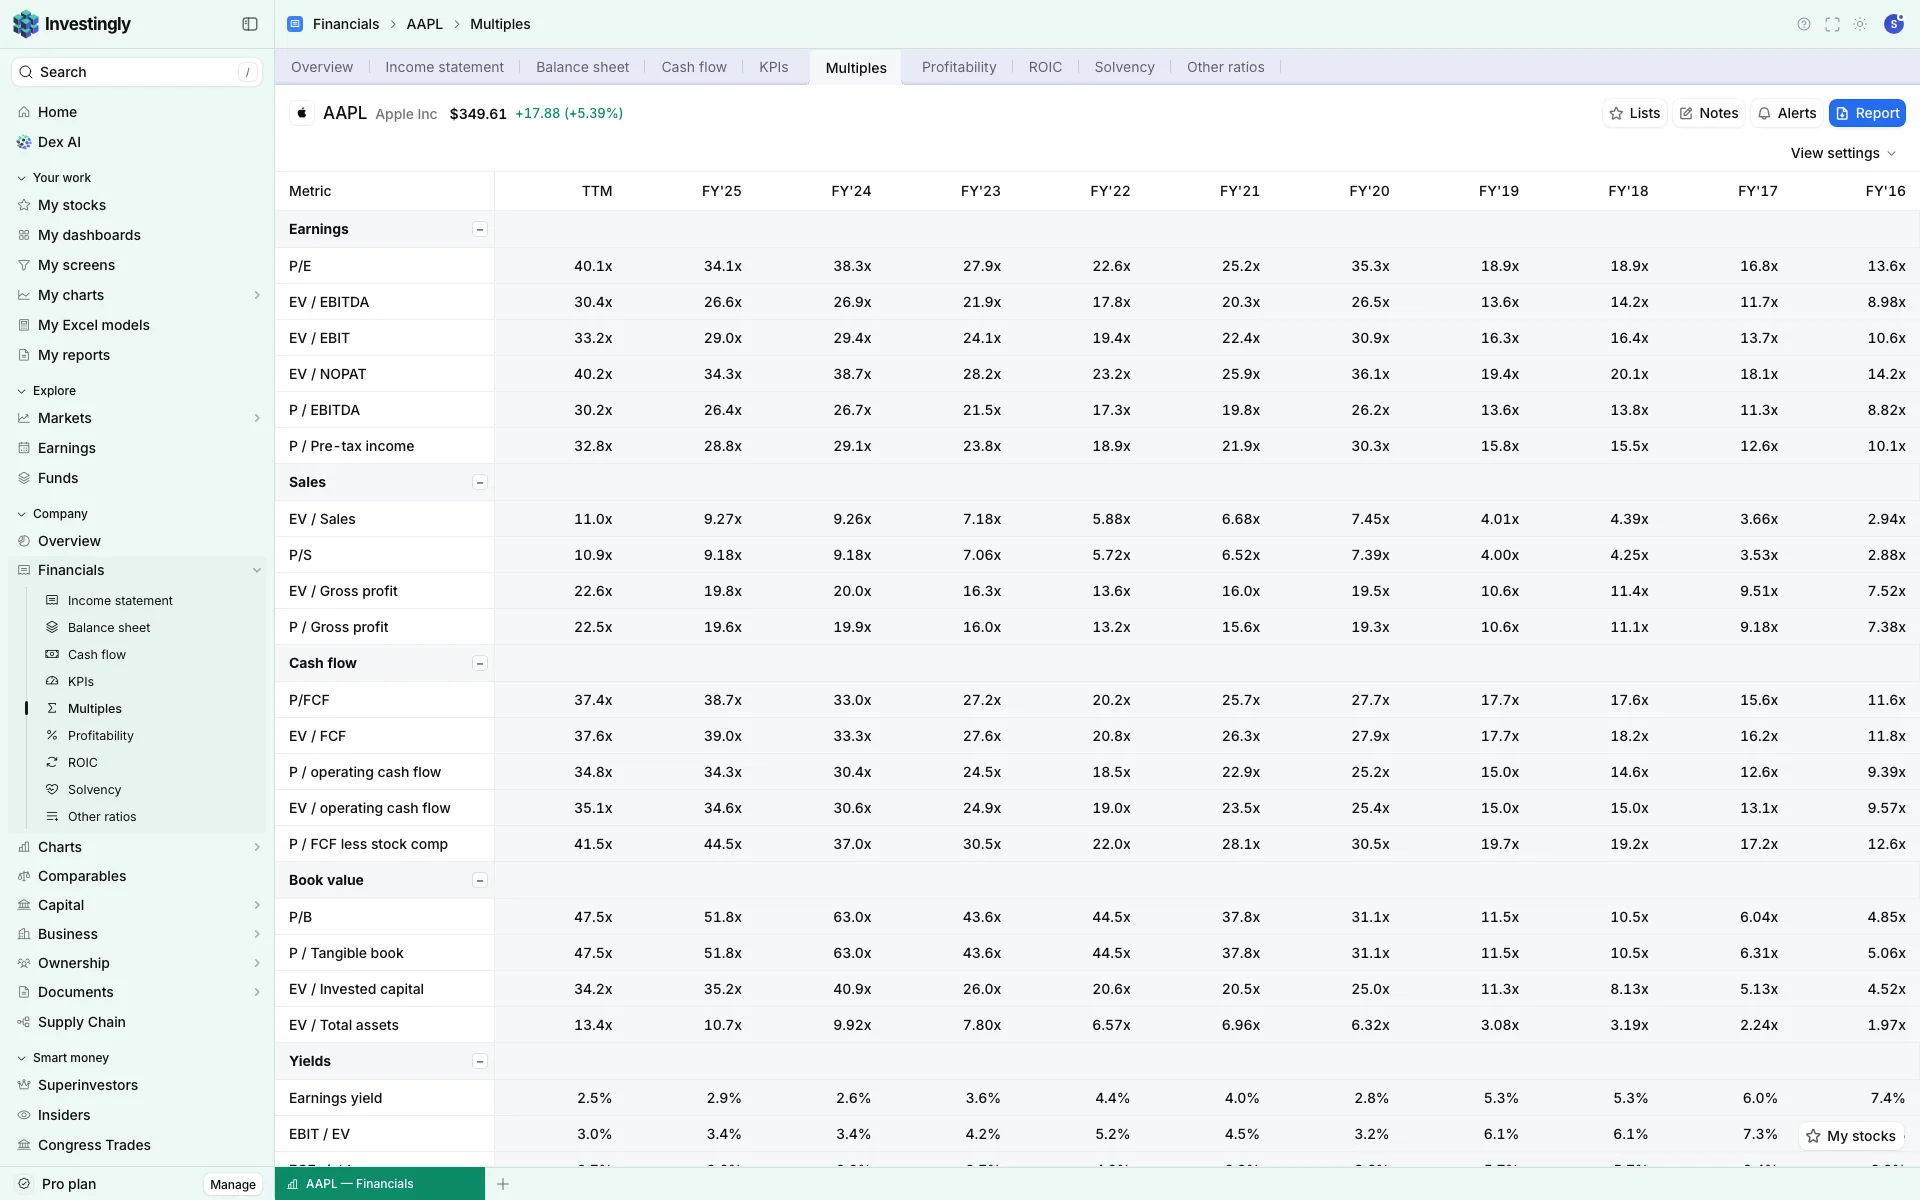
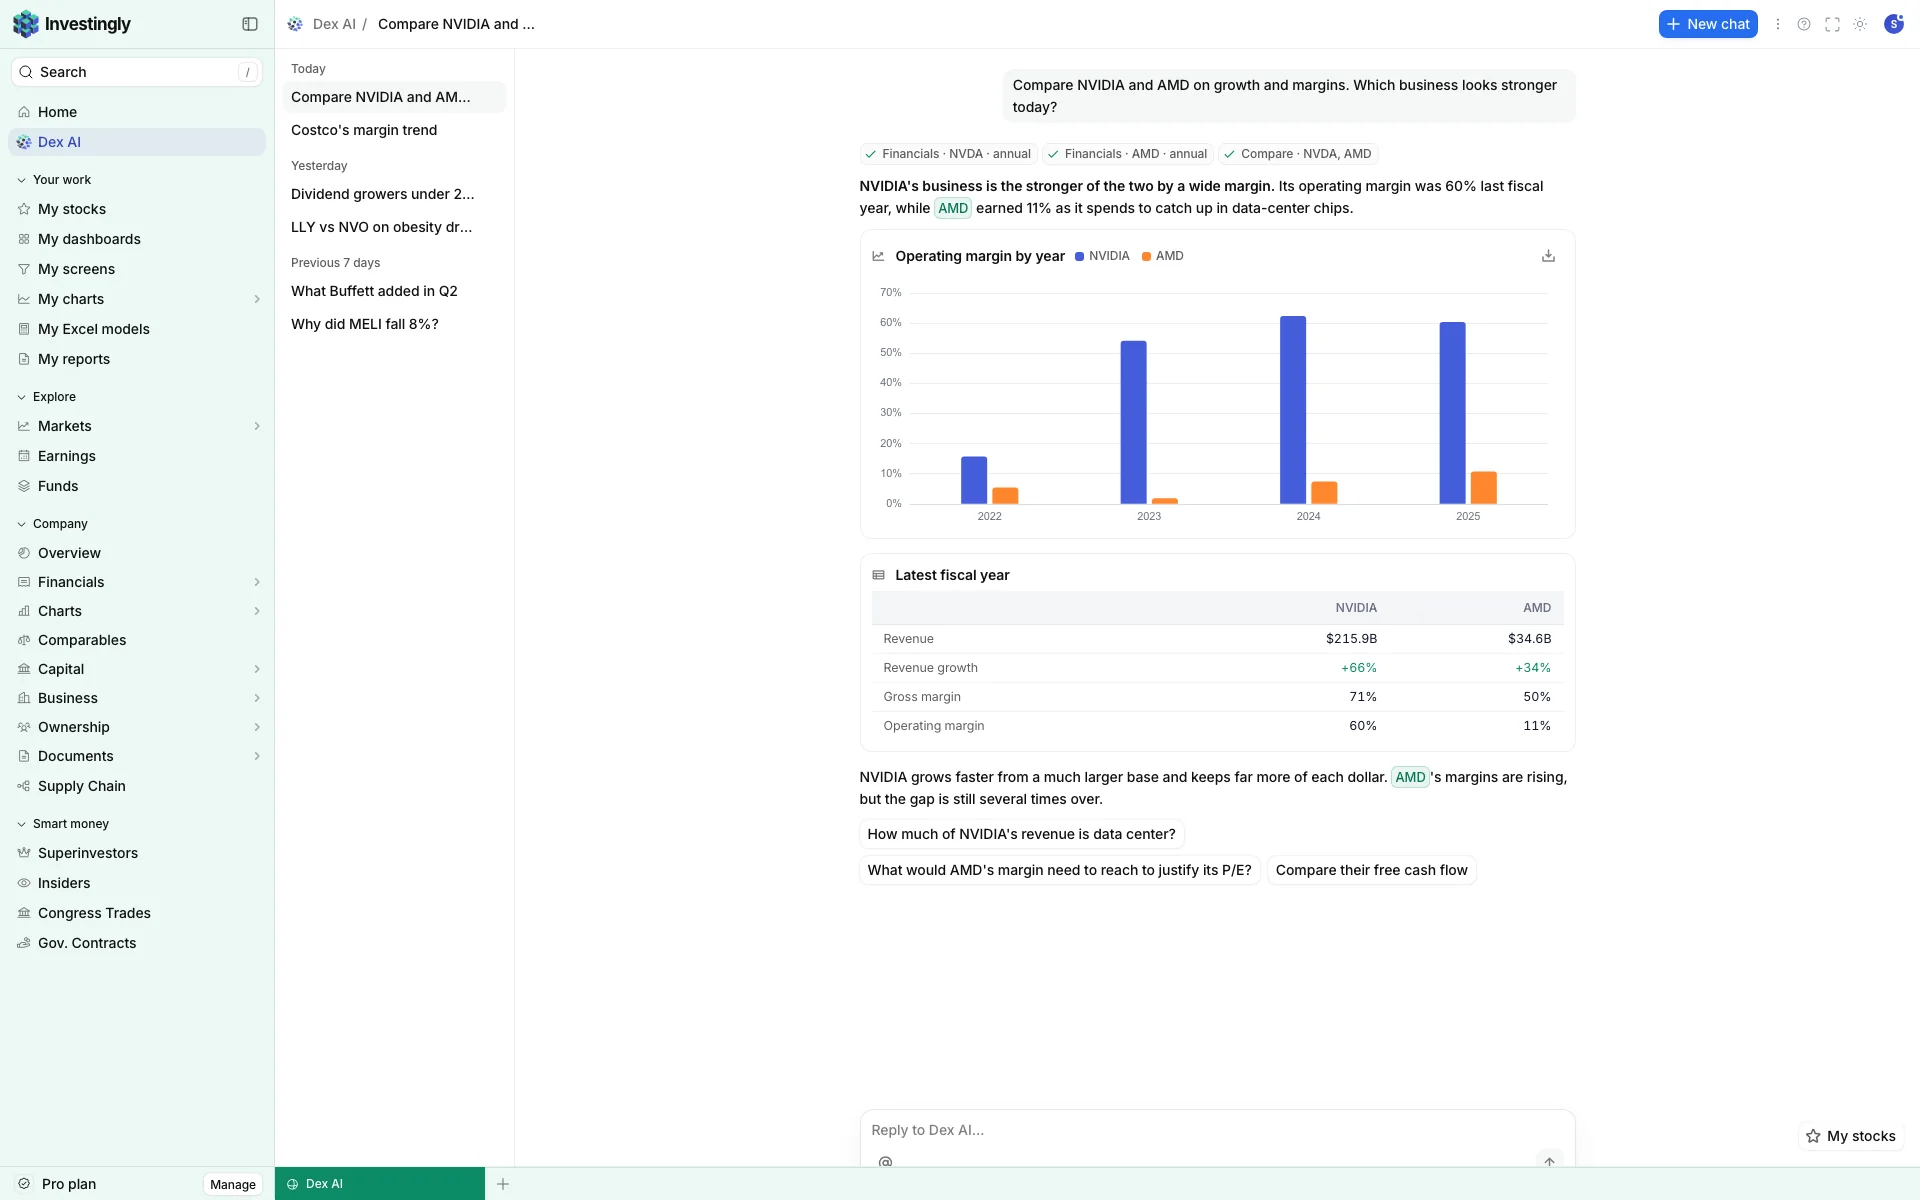
Most investing apps want you to trade more. Investingly is built for the opposite: reading the filings, checking the numbers, and owning a few businesses you understand.
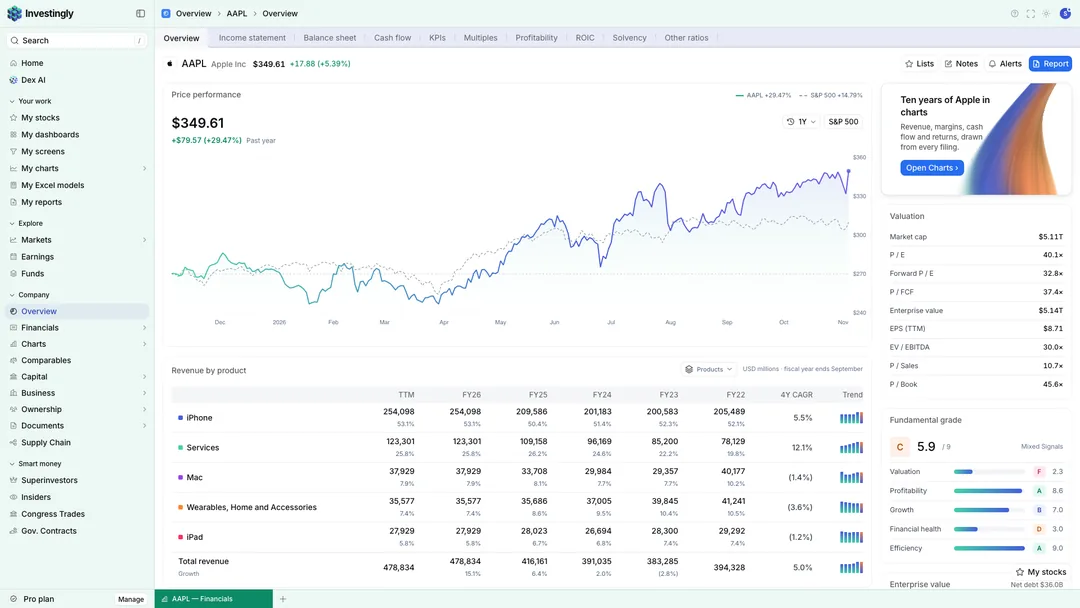
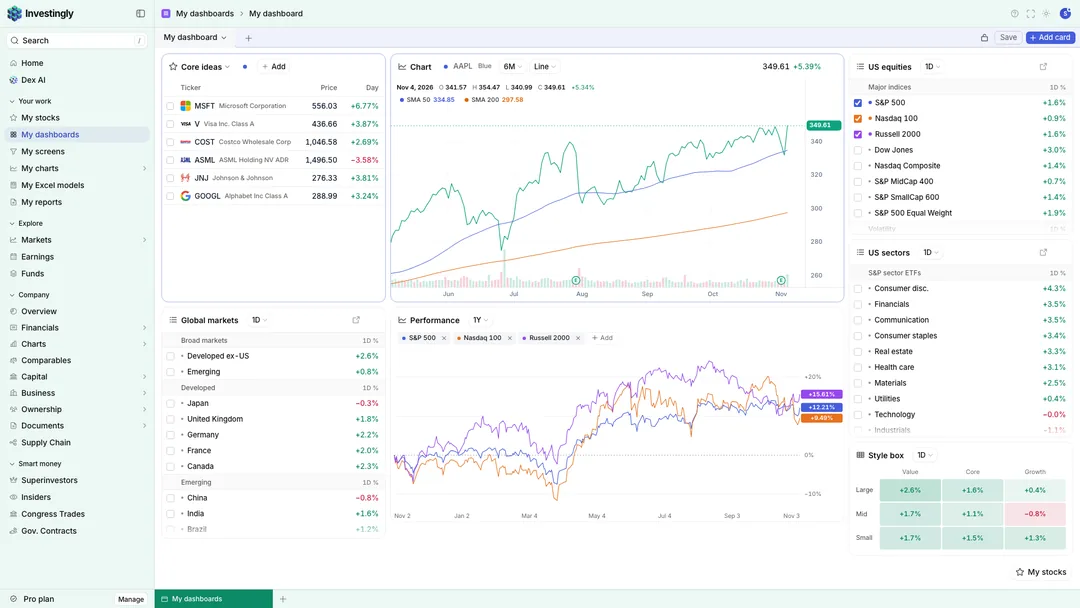
Switch between statements, charts, screens and portfolios without losing your place.
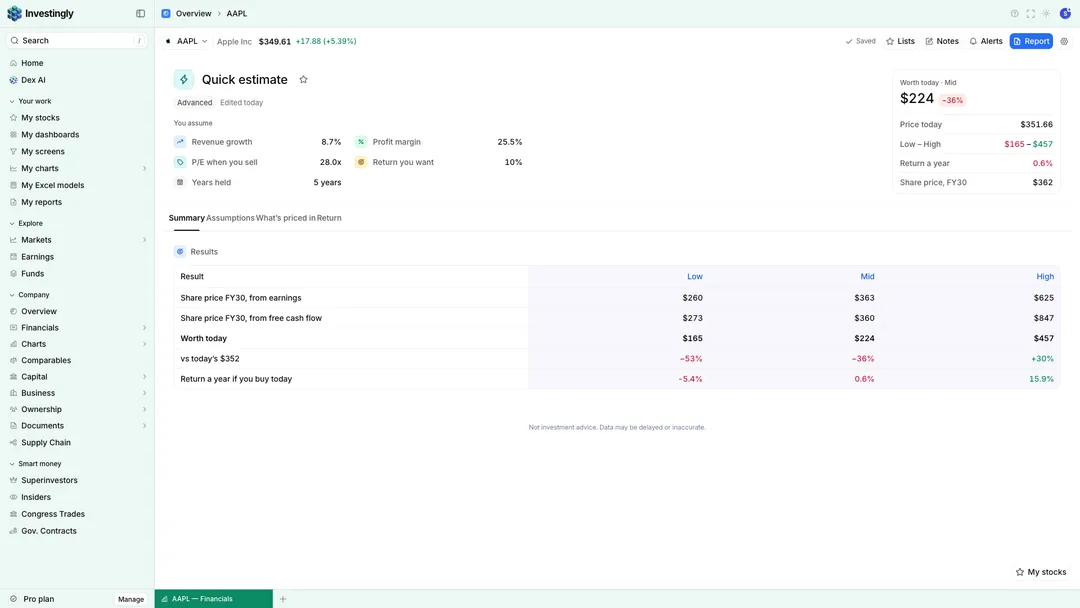
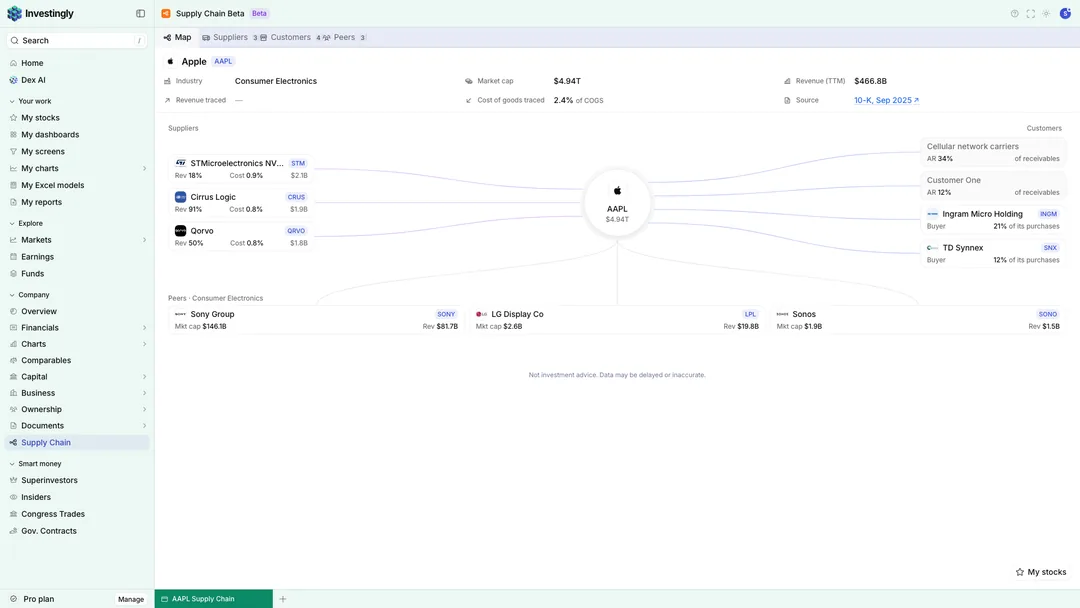
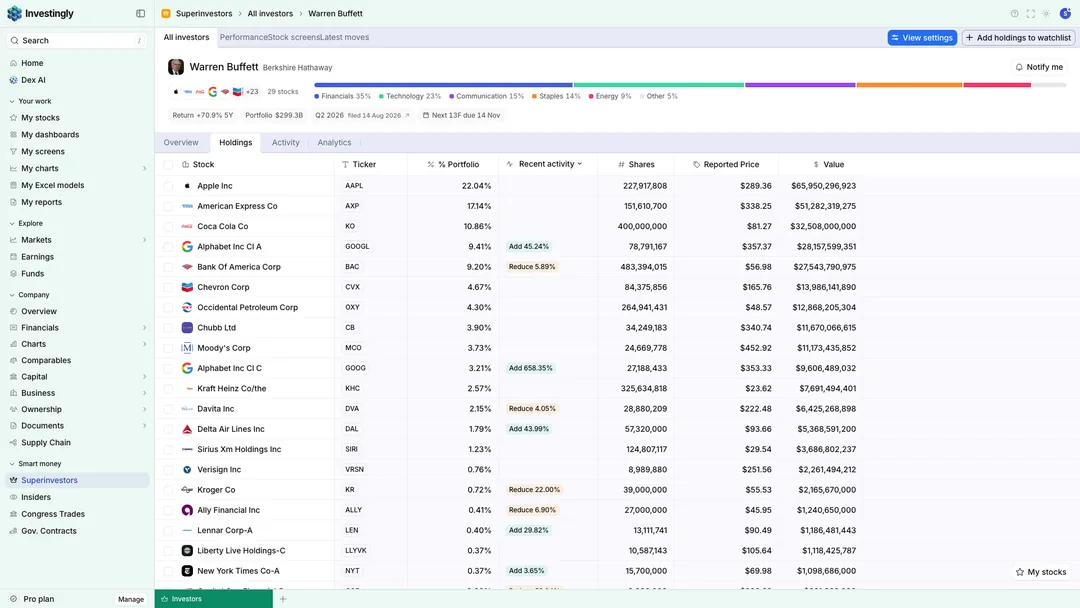
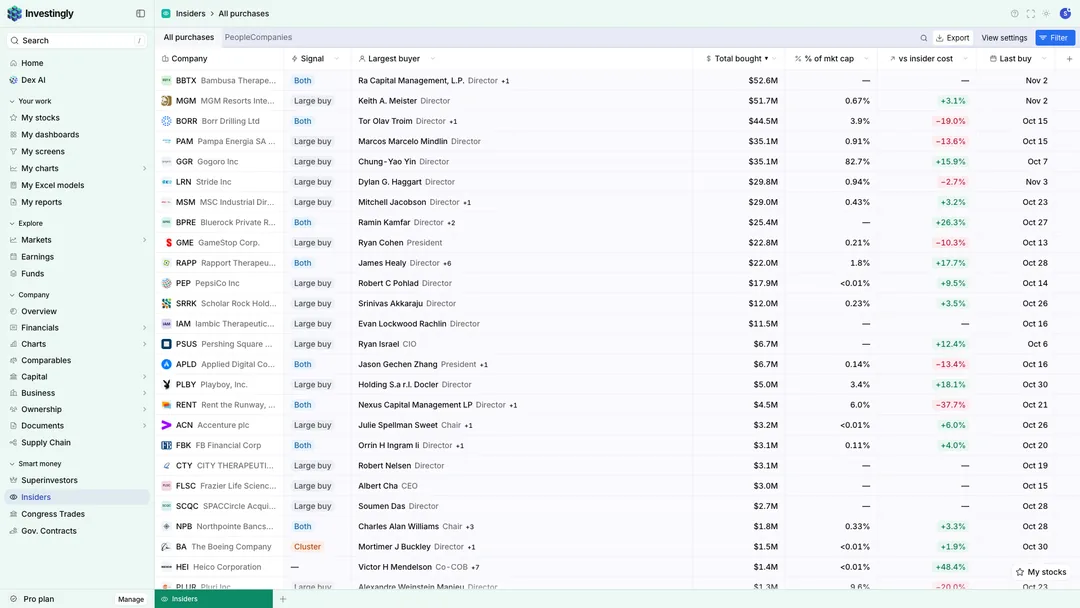
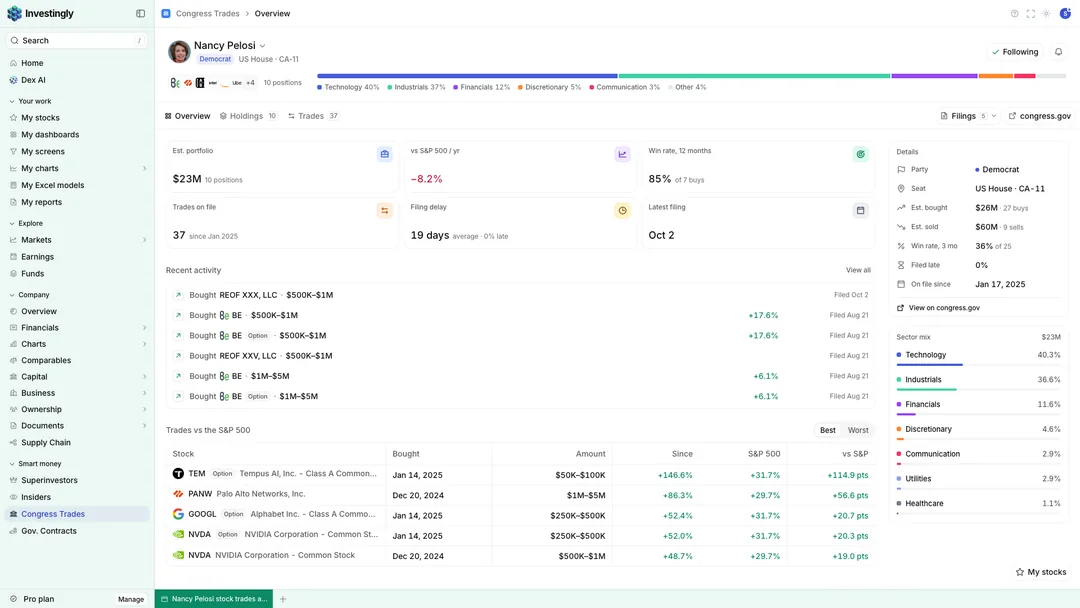
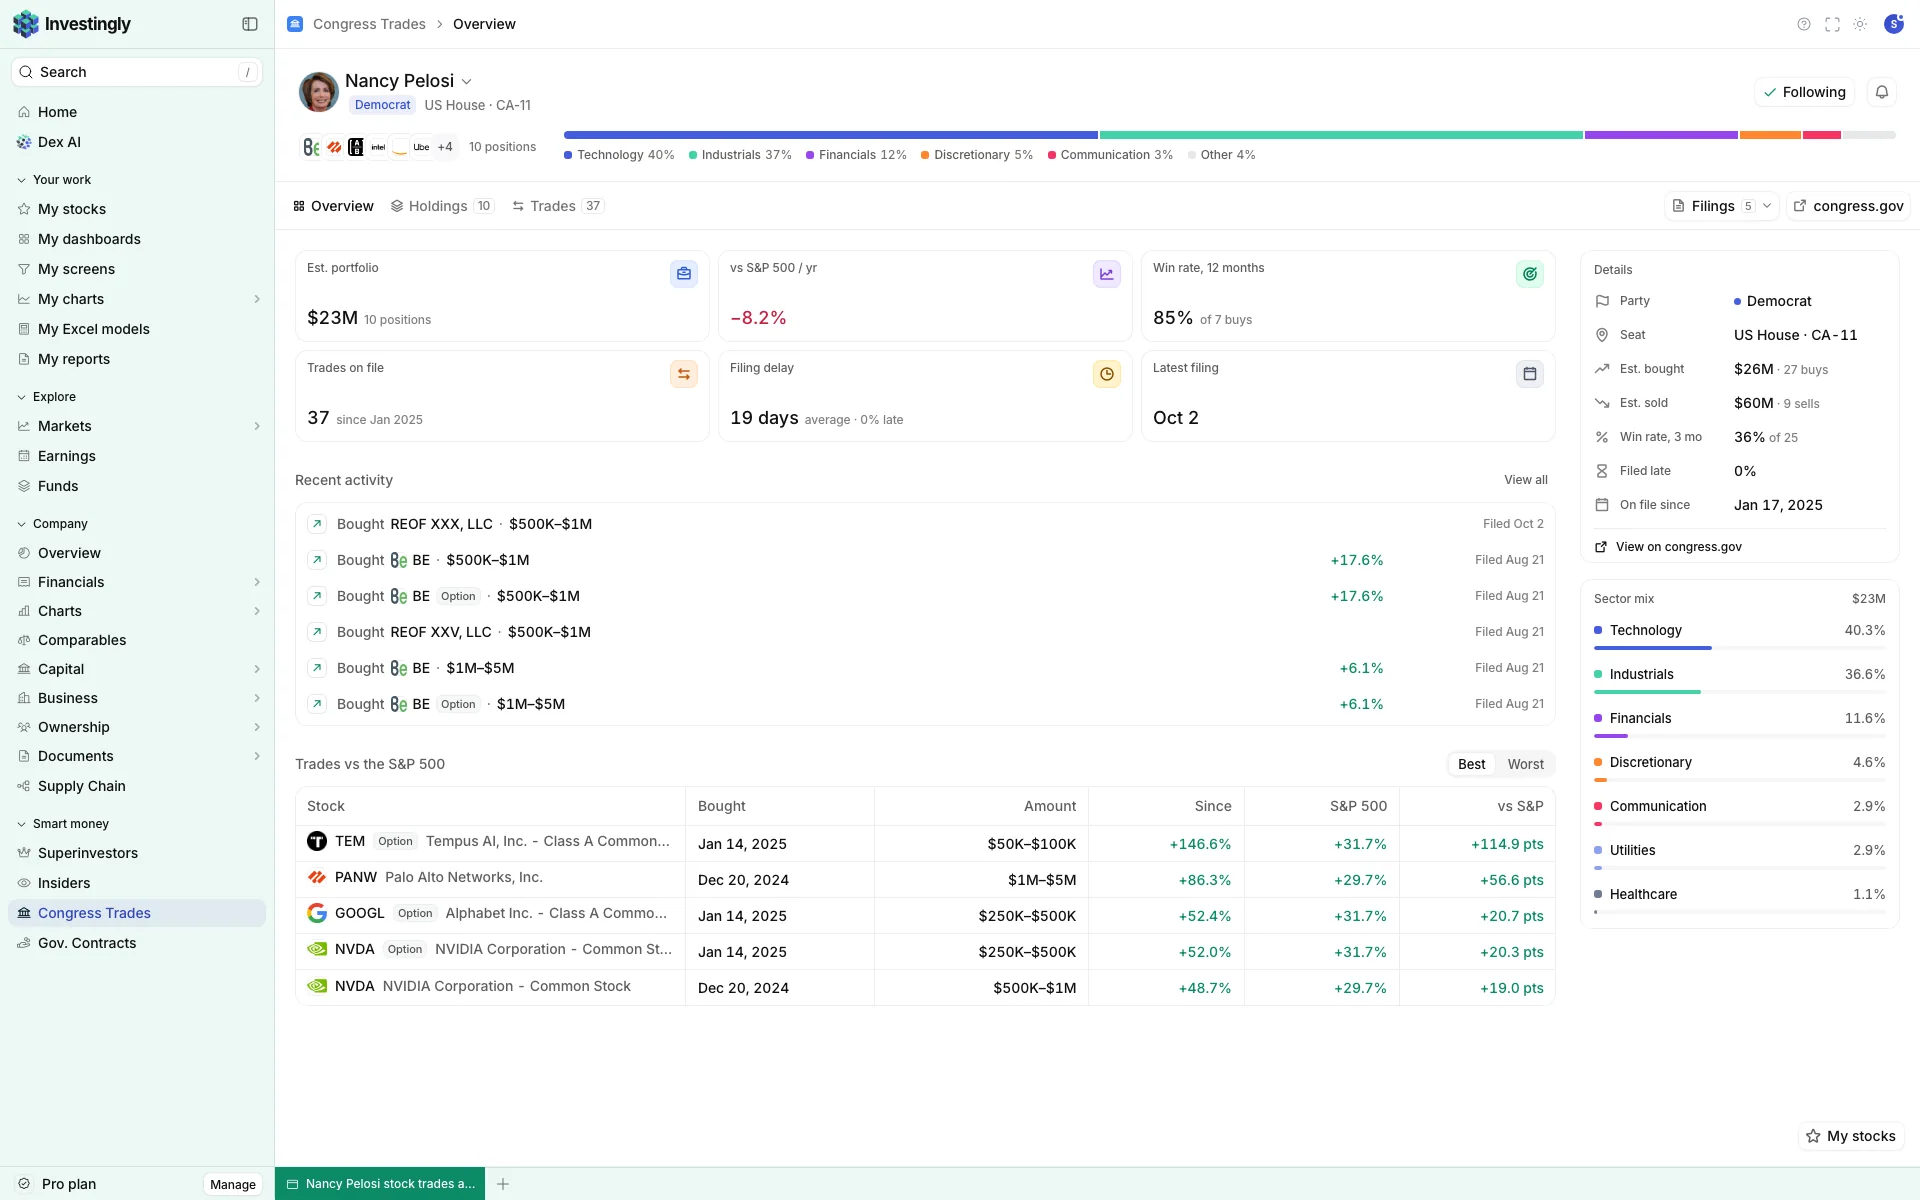
| Representative · bought NVDA | $50K–$100K |
| Representative · bought MSFT | $15K–$50K |
| Representative · sold AAPL | $1K–$15K |
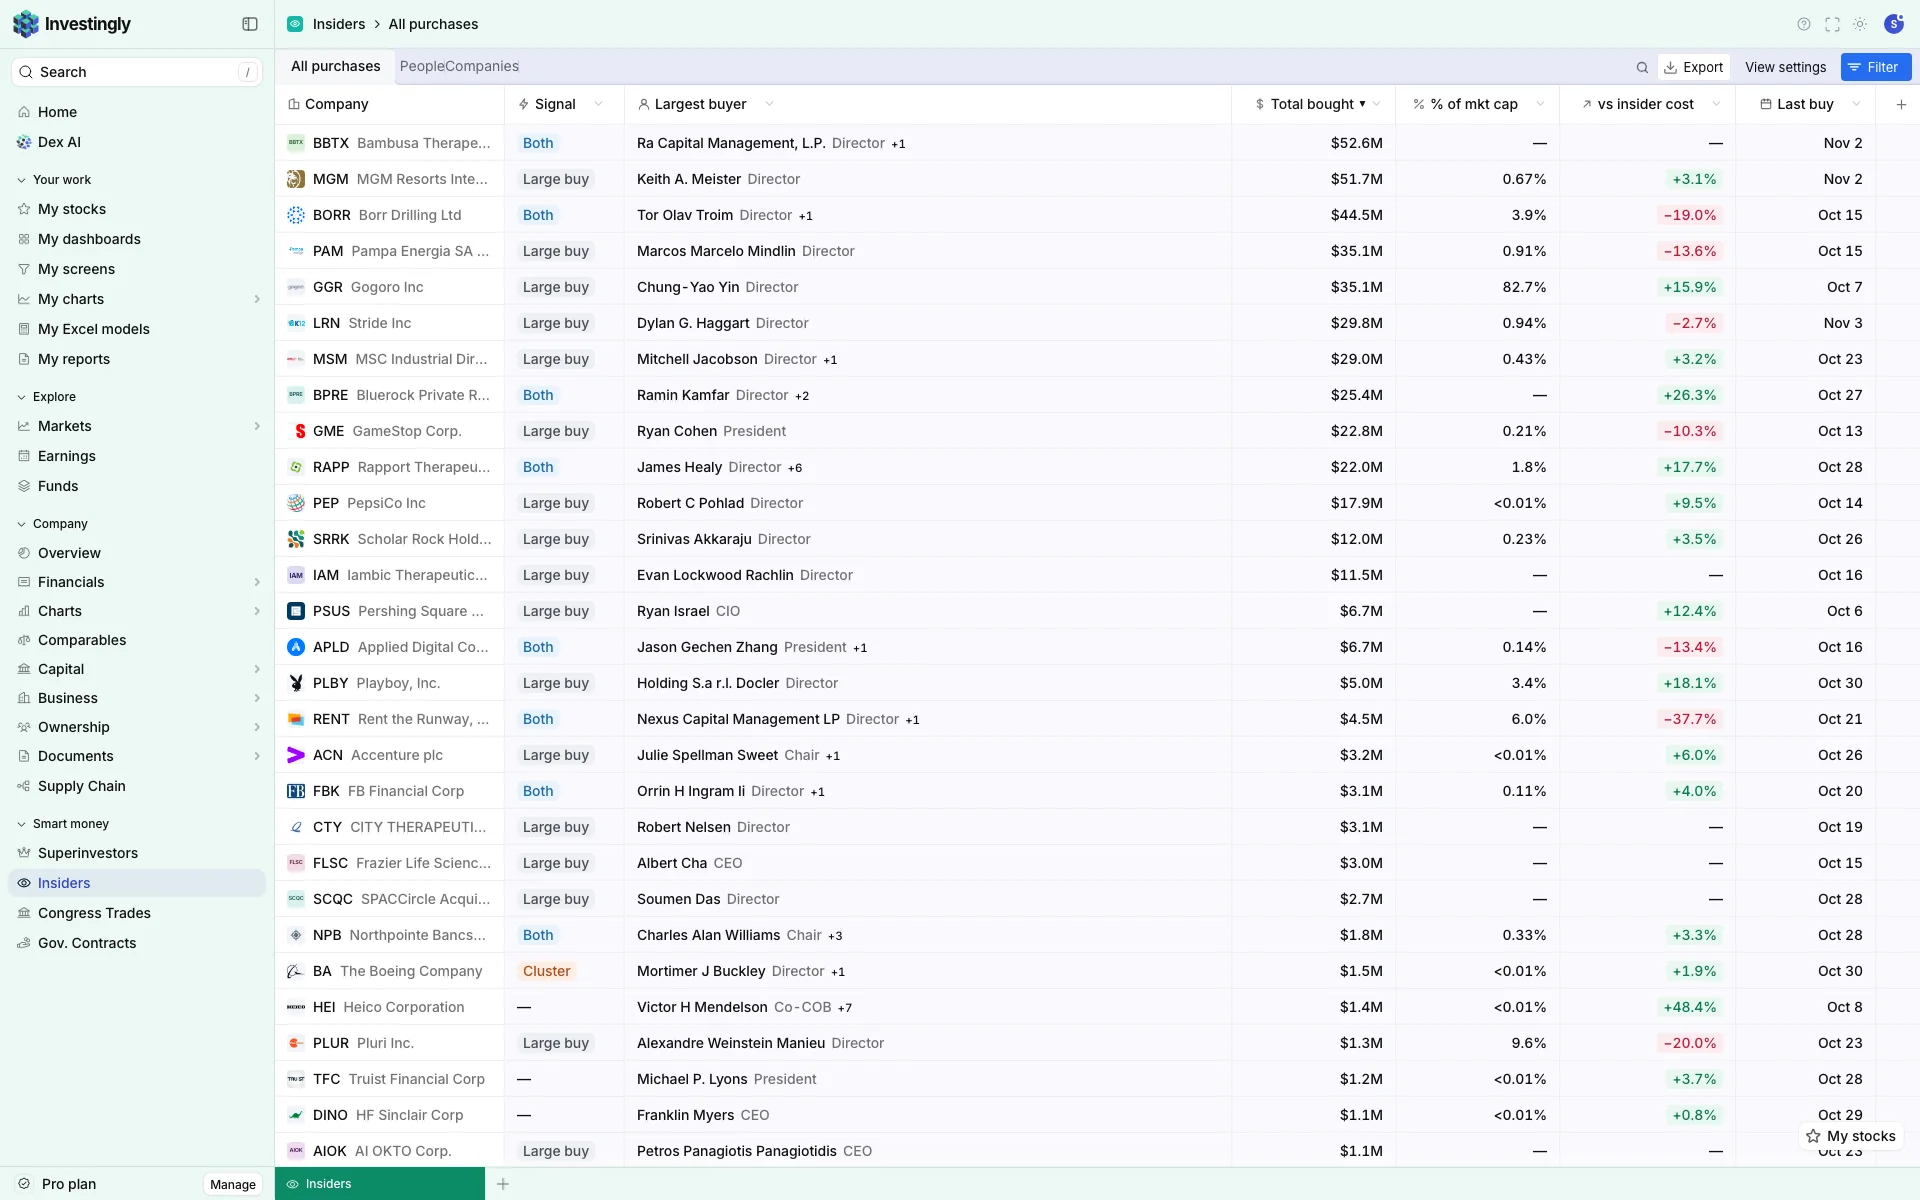
| CEO · bought | $4.2M |
| Director · bought | $1.1M |
| CFO · bought | $0.6M |
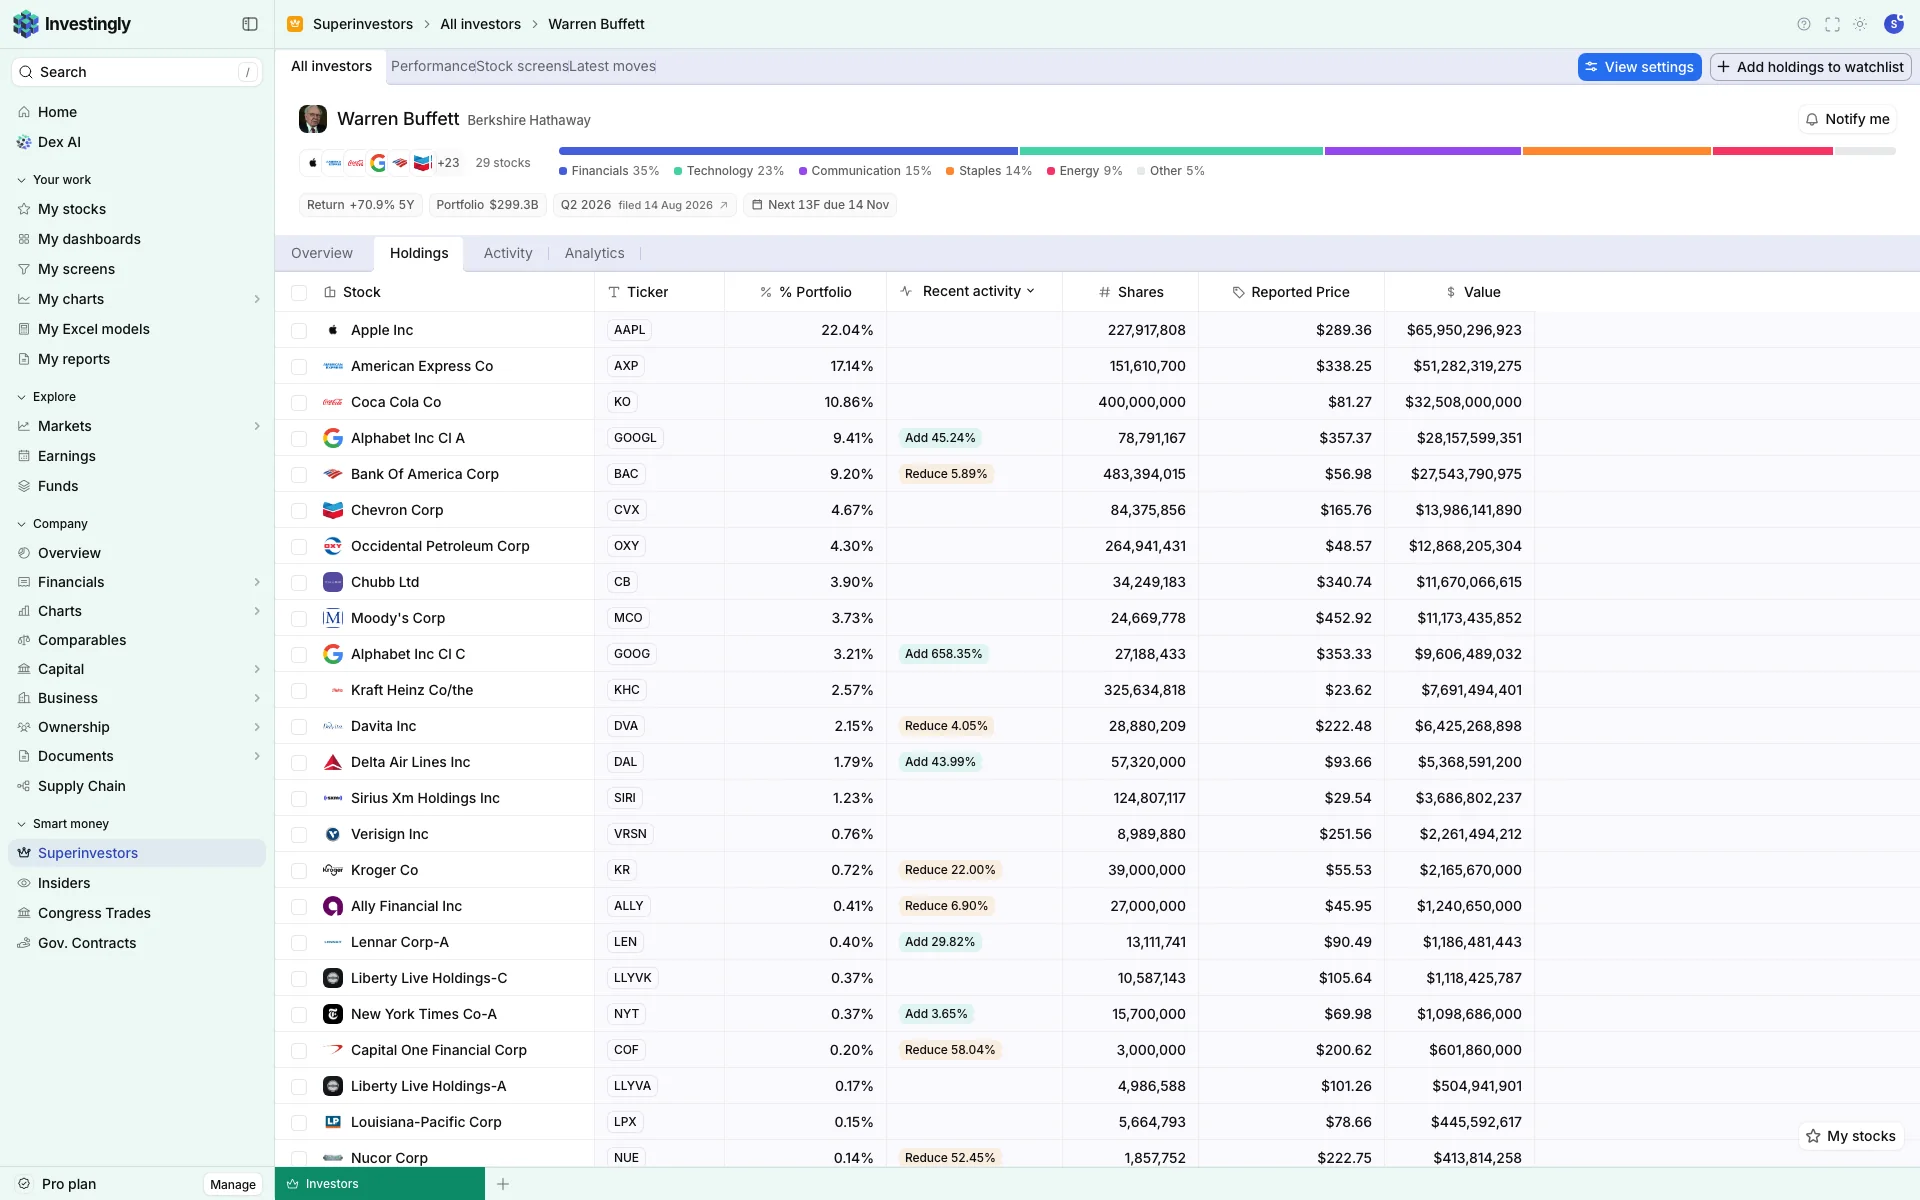
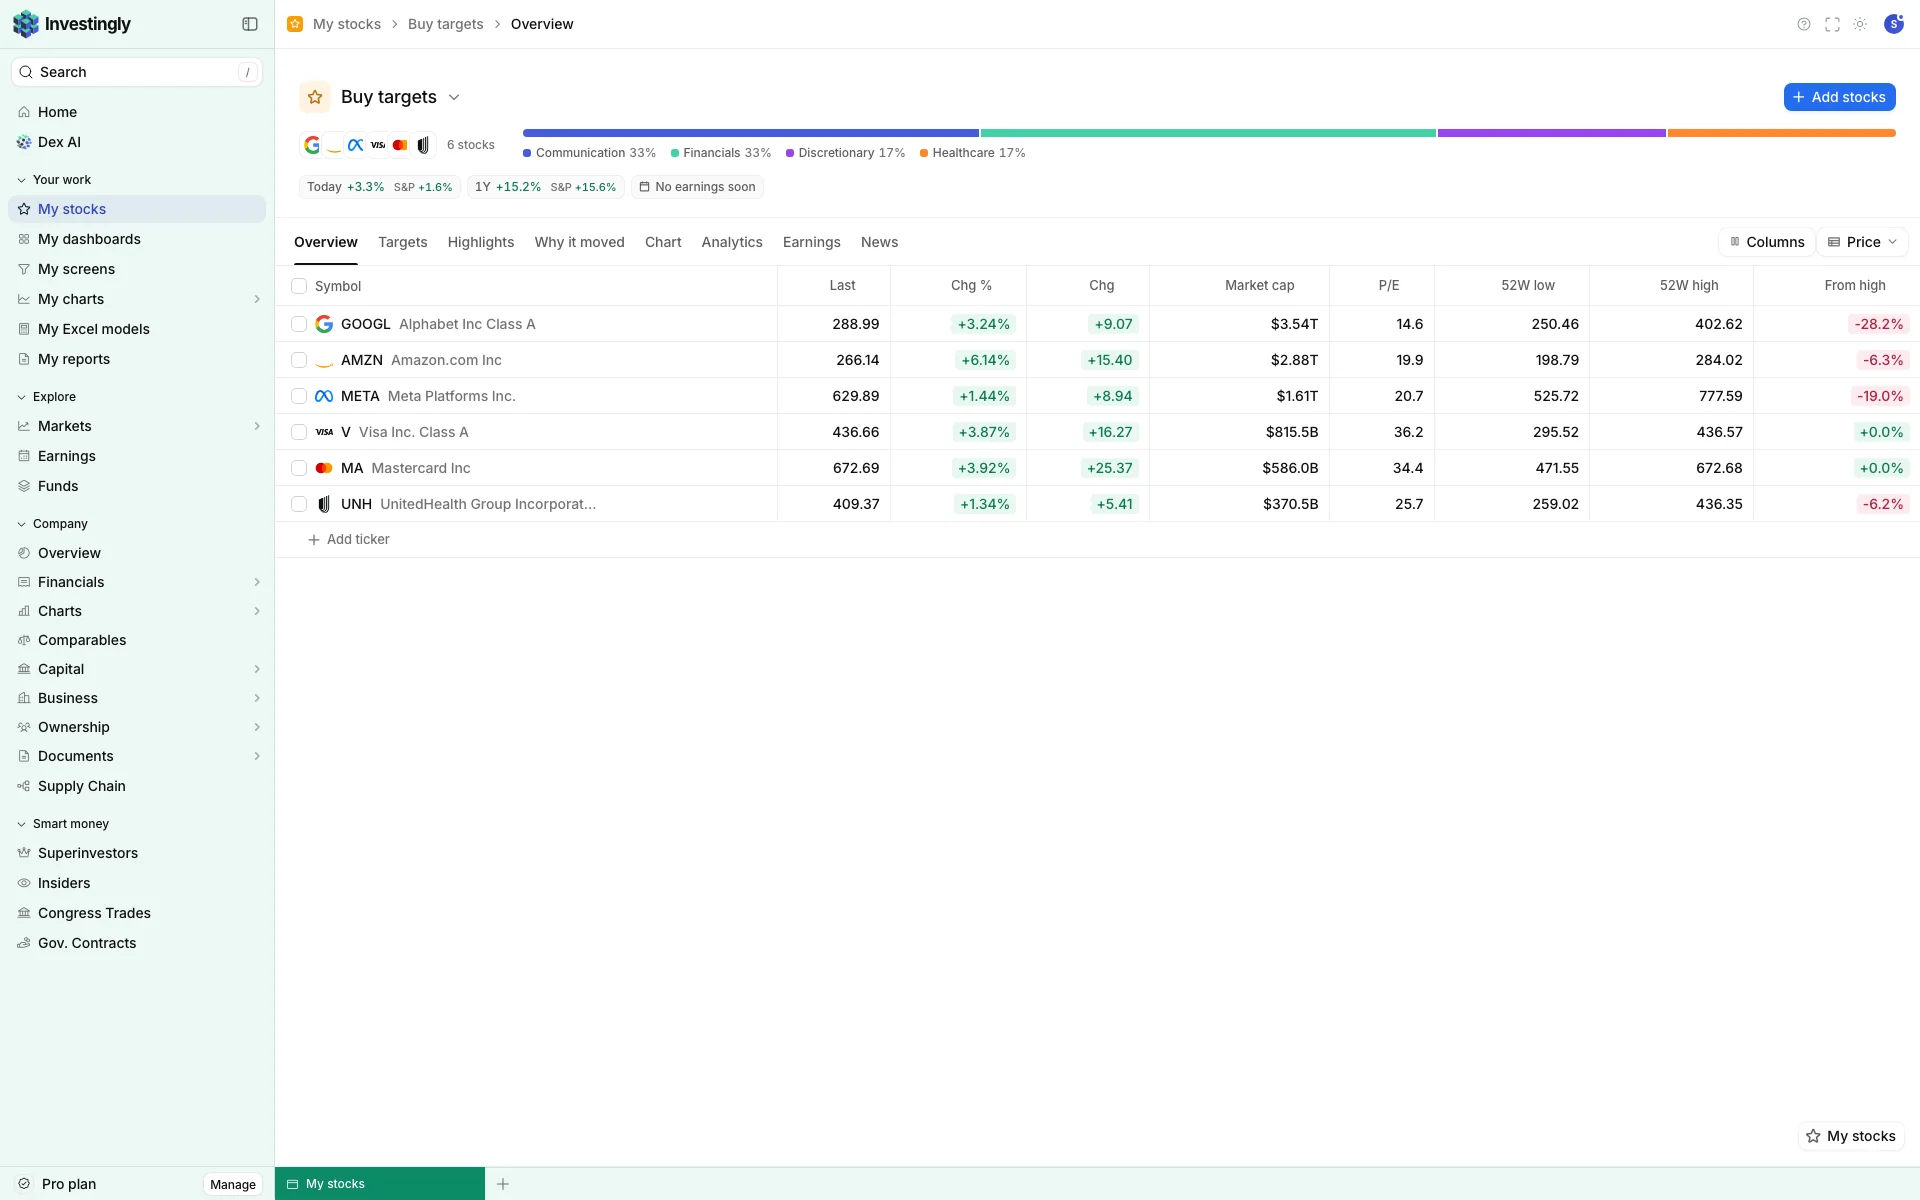
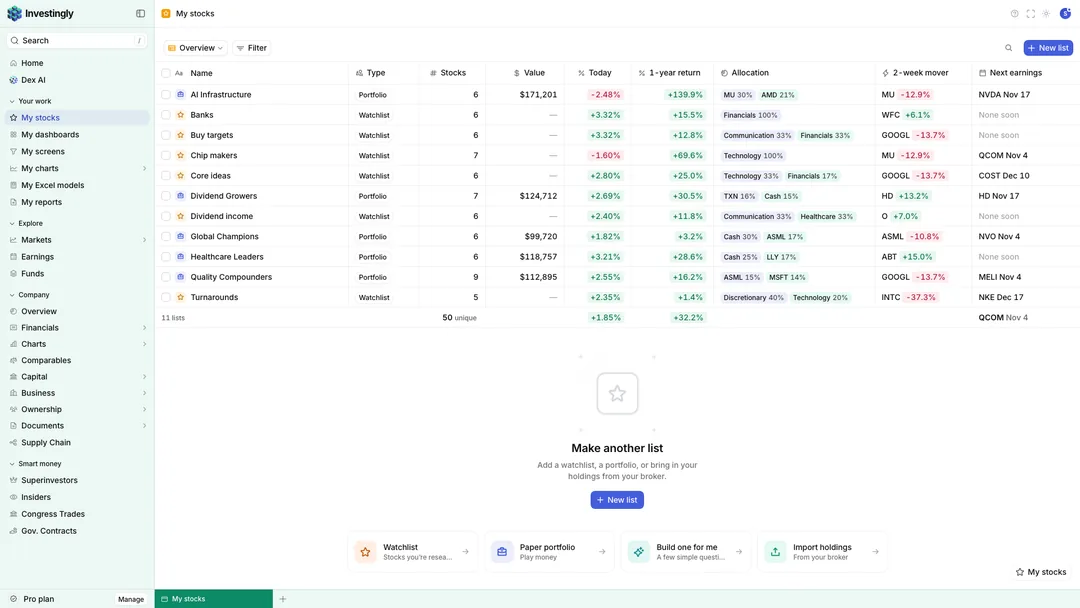
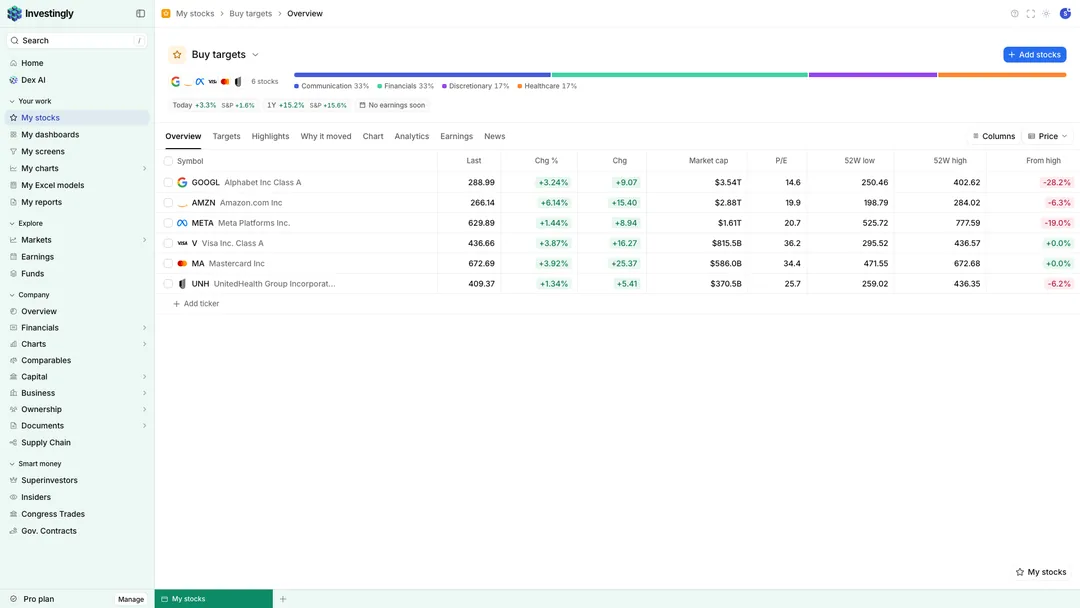
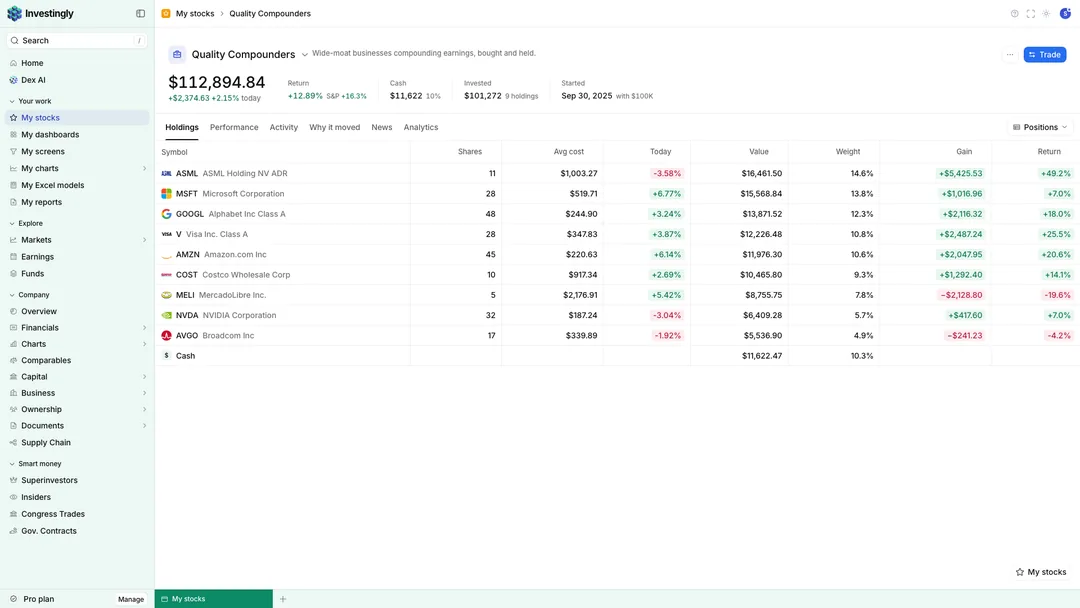
Watchlists and portfolios side by side, with what moved today.
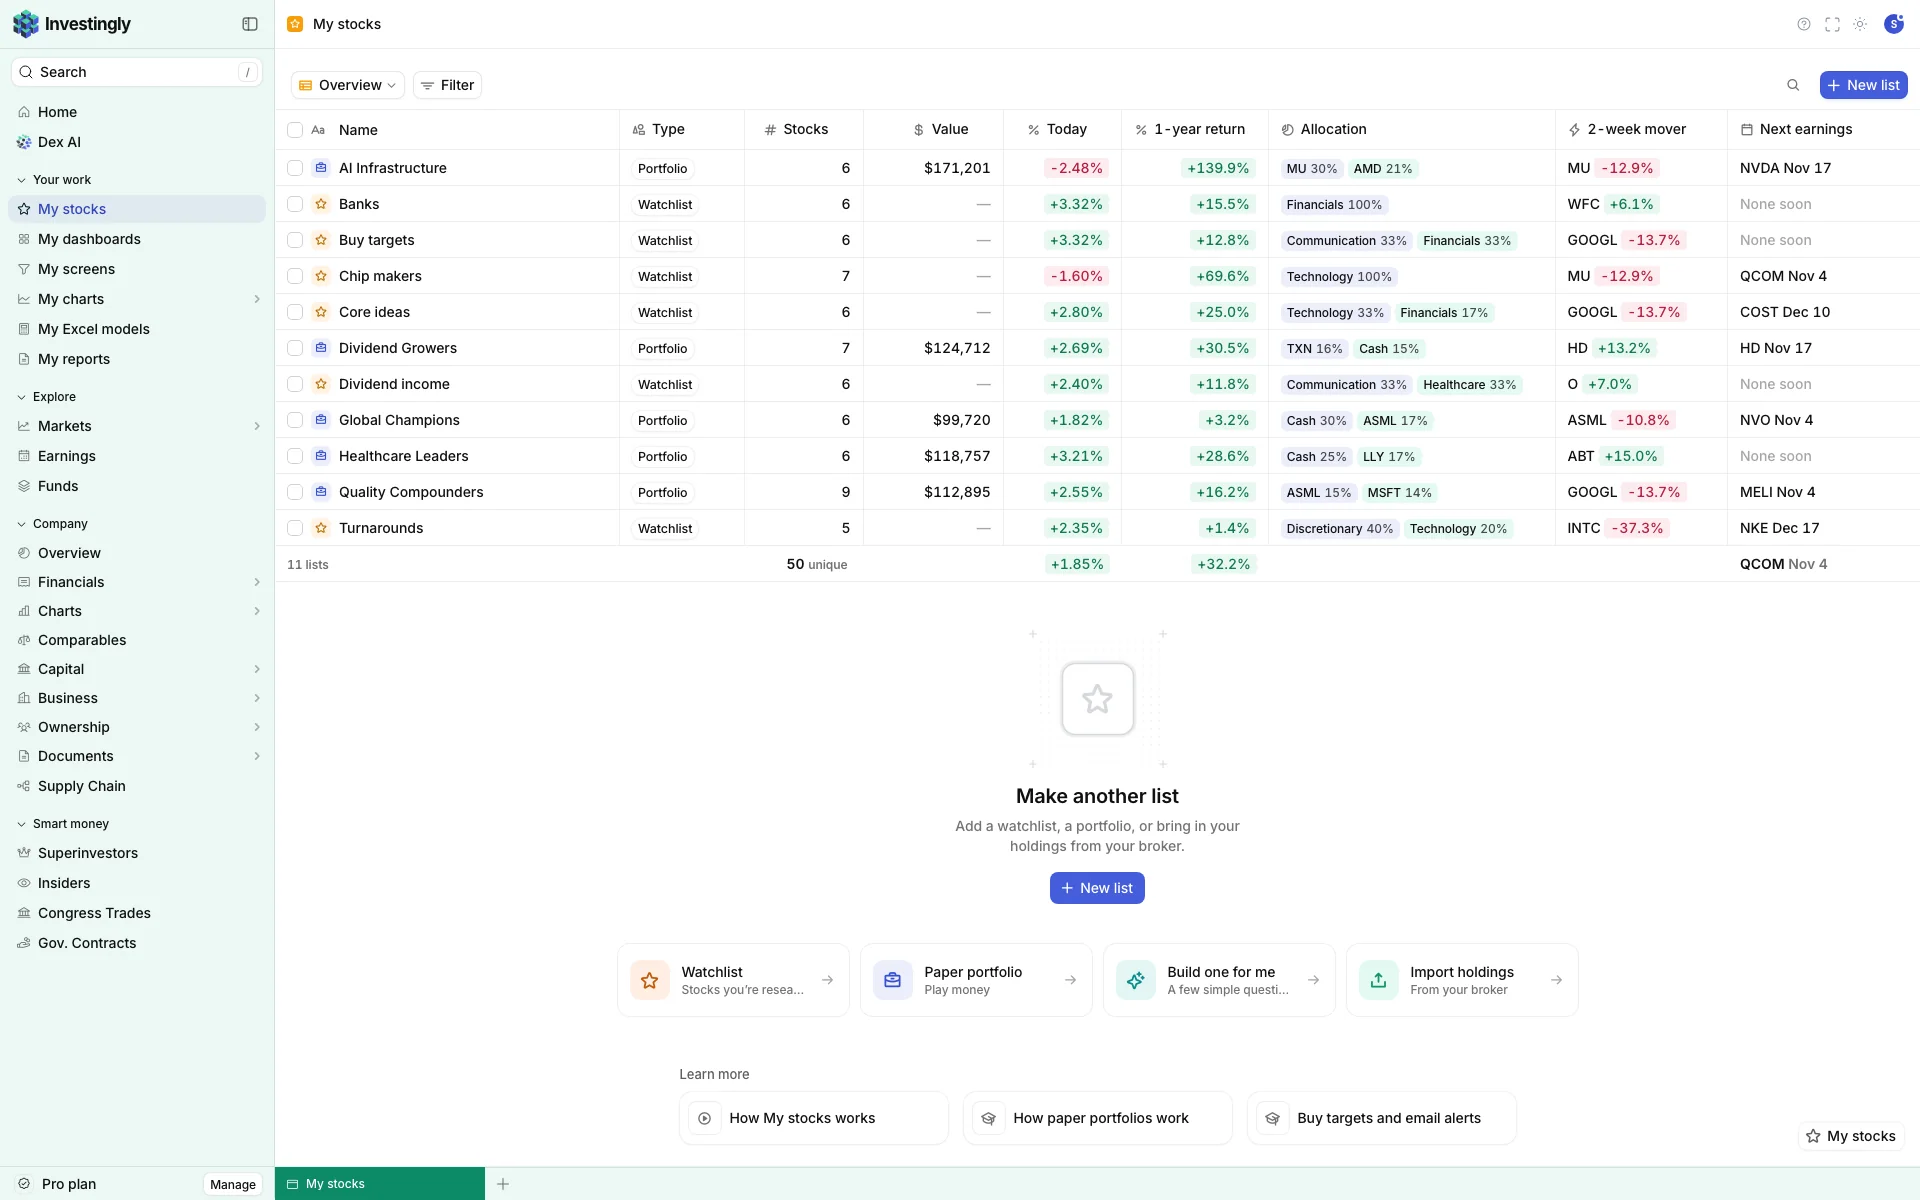
| Name | Price | Day | To buy | 3M |
|---|---|---|---|---|
| MSFT | 516.20 | +0.41% | 8% | |
| COST | 912.40 | −0.32% | 7% | |
| ASML | 812.00 | +1.18% | 7% | |
| V | 348.30 | +0.22% | 6% | |
| DUOL | 281.50 | −1.40% | 8% |
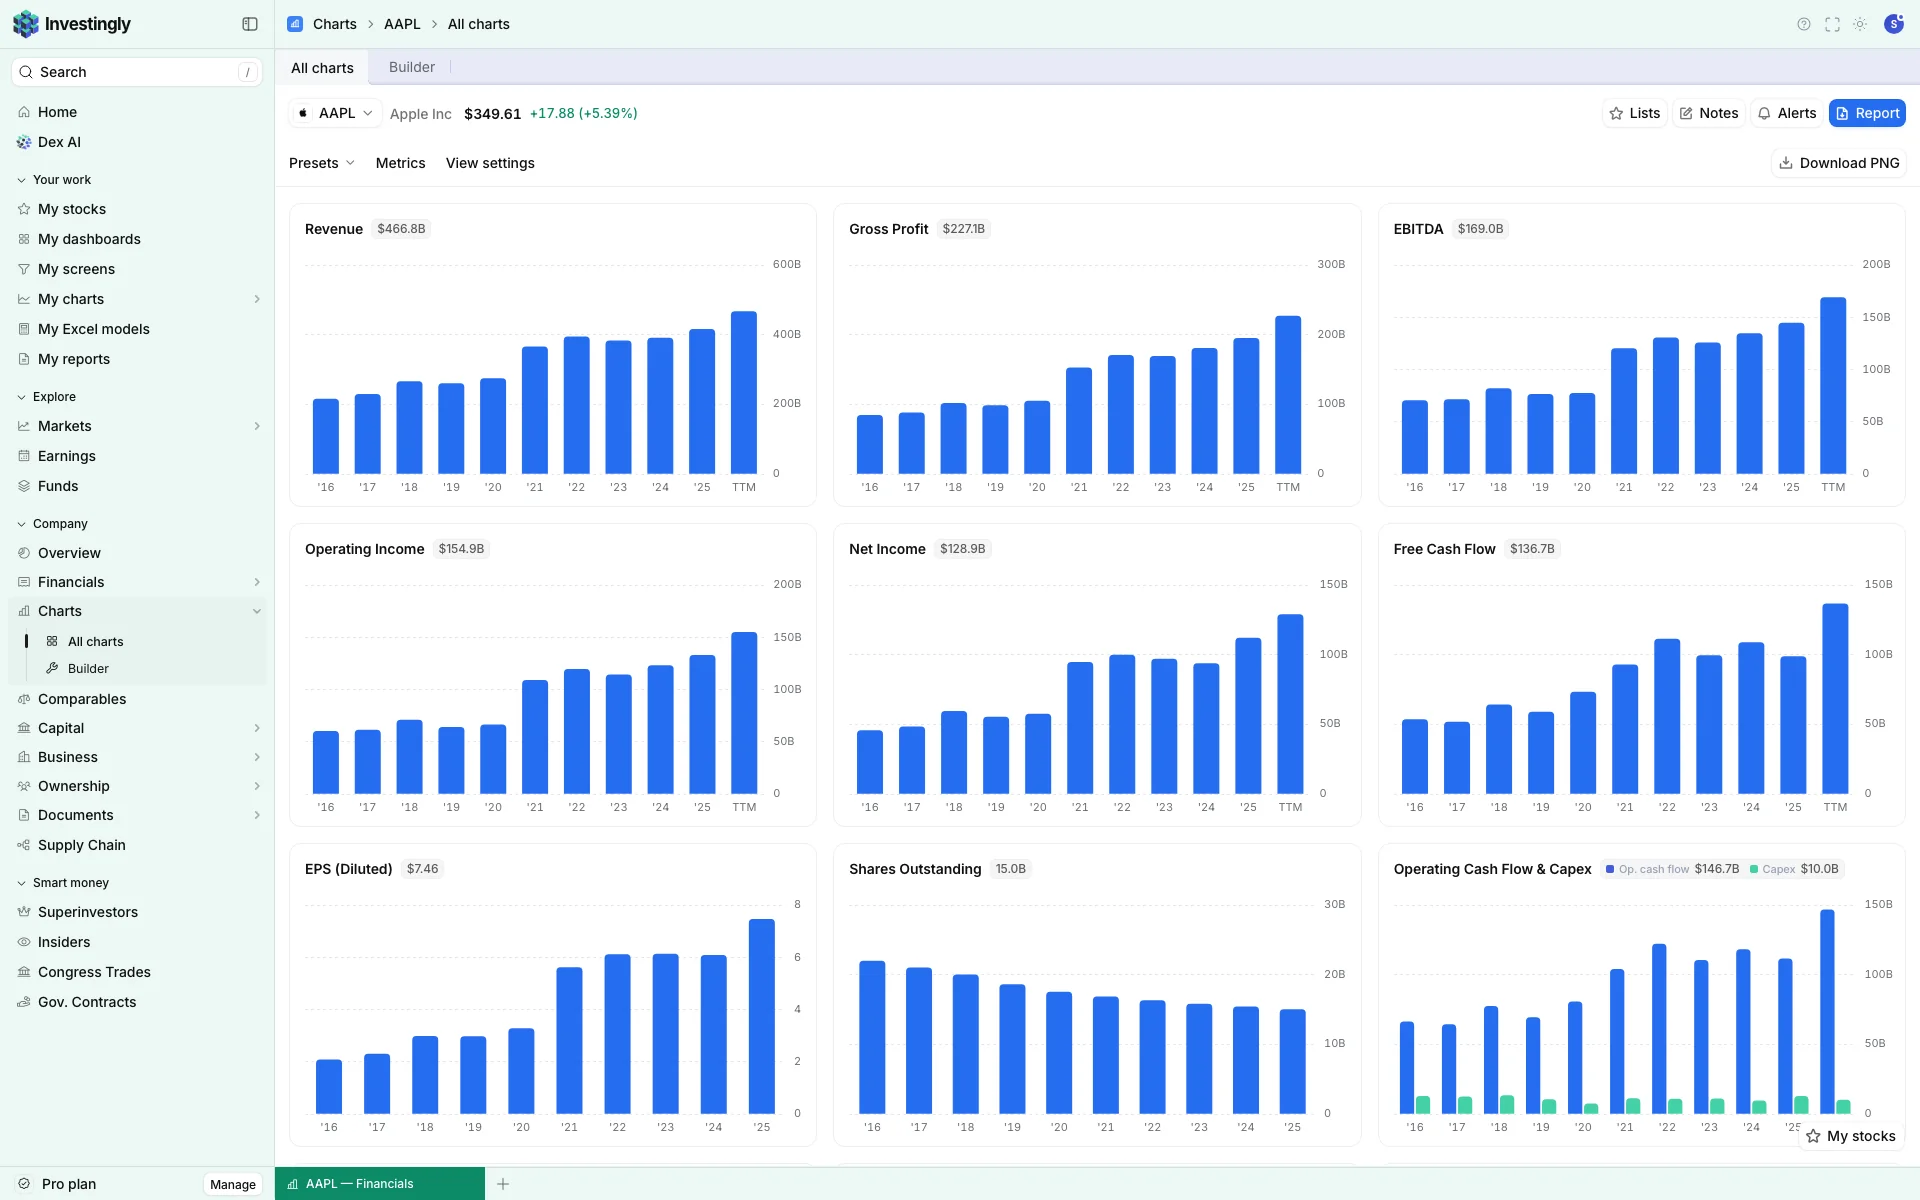
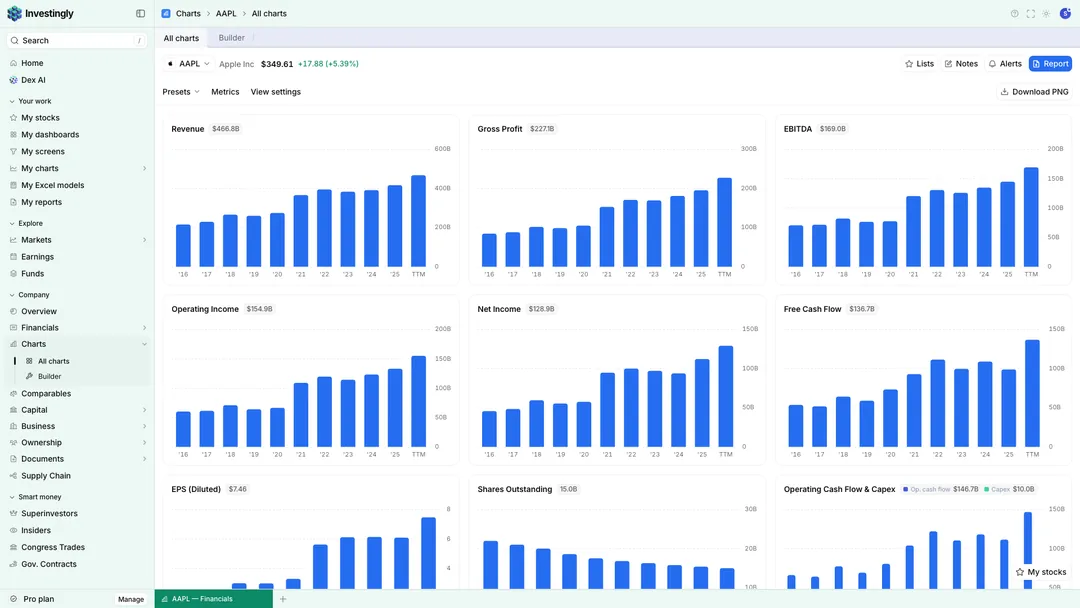
See how a business really compounds. 20+ years of statements, charted and compared, so you can judge the long run for yourself.
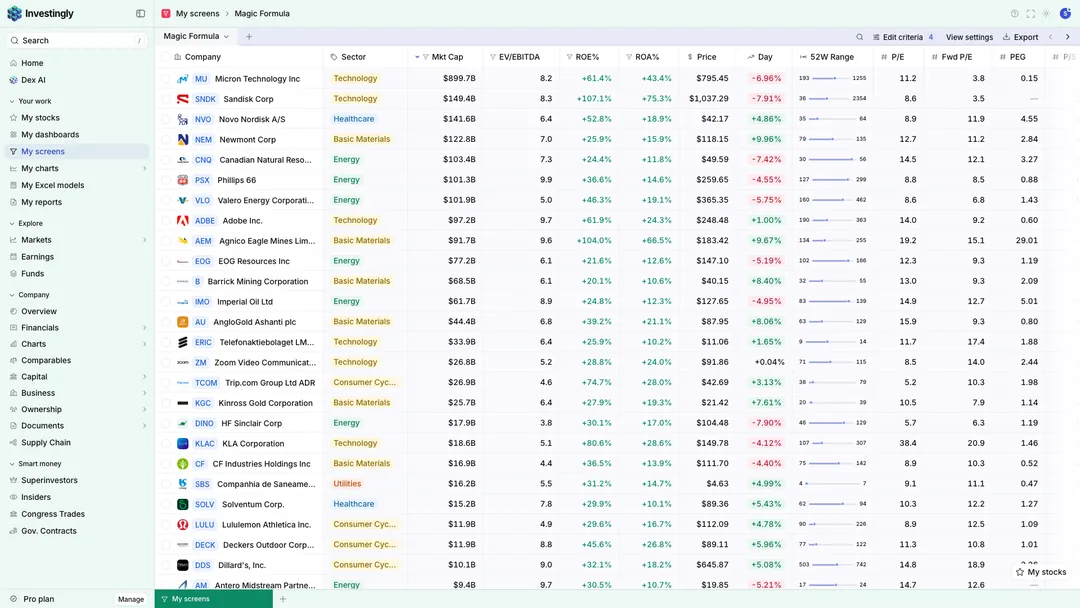
Screen on Saturday, shortlist by Sunday. Filter thousands of stocks on any metric, then dig into the few that pass.
Let the alerts watch the tape. Buy targets and filing alerts arrive by email, so you only look when something changes.
Practise before you put money in. Build models and paper portfolios, and see how your calls would have played out.
Your research is there at midnight. Notes, watchlists and models stay in sync on every device.